Microsoft Power BI Data Analyst
Last Update Jul 25, 2026
Total Questions : 464
We are offering FREE PL-300 Microsoft exam questions. All you do is to just go and sign up. Give your details, prepare PL-300 free exam questions and then go for complete pool of Microsoft Power BI Data Analyst test questions that will help you more.


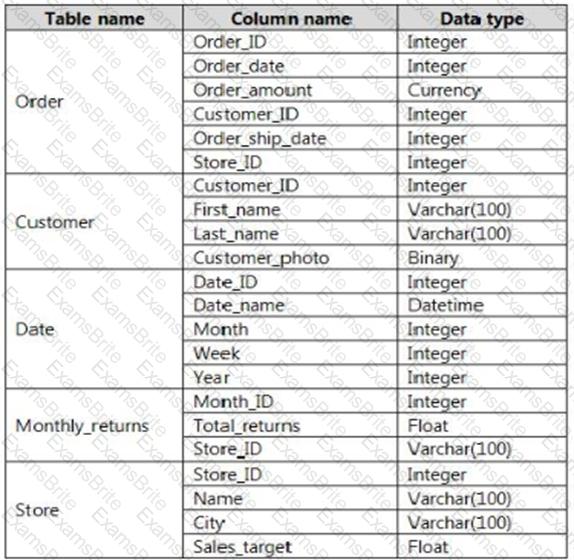
You need to create the semantic model.
Which storage mode should you use for the tables in the semantic model?
A.
live connection
B.
Dual
C.
Import
D.
DirectQuery
You use Power BI Desktop to open a PBIX file that contains a Microsoft Excel data source.
You attempt to refresh the data and receive the following error message.
Expression.Error: The Colum ‘cost’ of the table wasn’t found.
What is a possible cause of the error?
A.
The Cost column was renamed in the data source.
B.
The data in the Cost column cannot be converted into the target data type.
C.
The privacy level of the data source does not allow combining the data with other data sources.
D.
The source file was moved to a new location.
You need to minimize me size of the dataset. The solution must meet the report requirements What should you do?
A.
Change lite OrderlD column in the Orders table to the text data type.
B.
Filter out discontinued products while importing the Product table.
C.
Remove the QuantityPerUnit column from the Products table
D.
Group the Categories table by the CategorylD column.
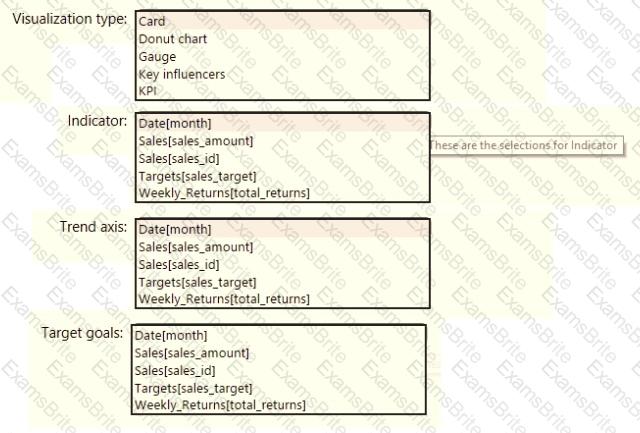
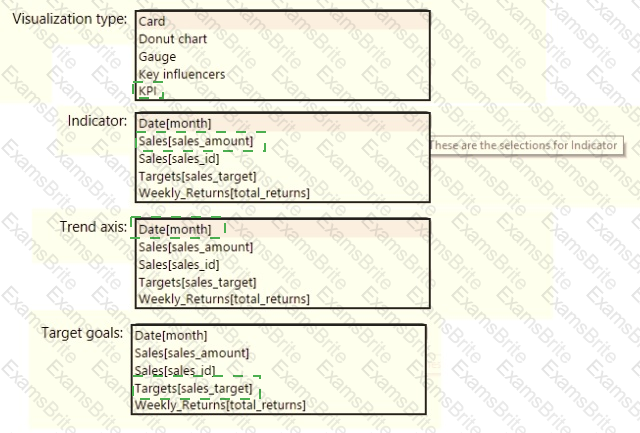
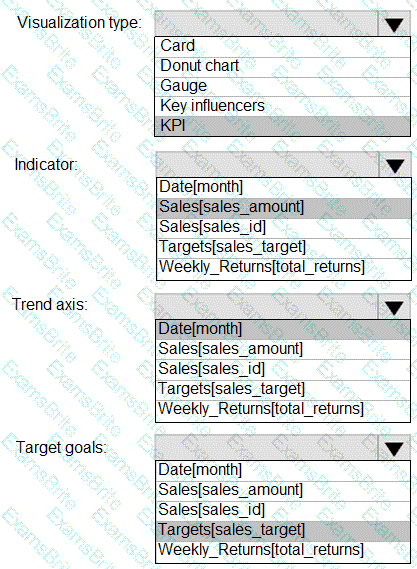
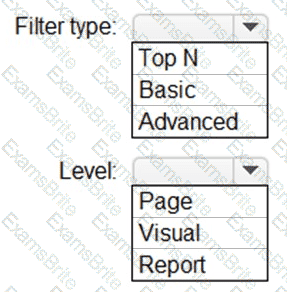
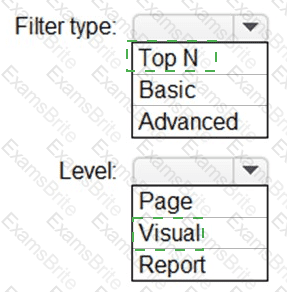
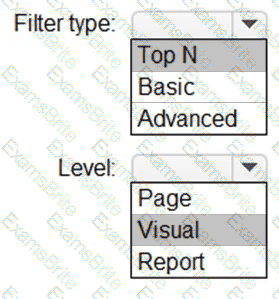
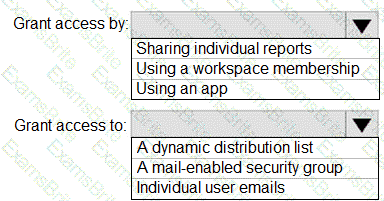
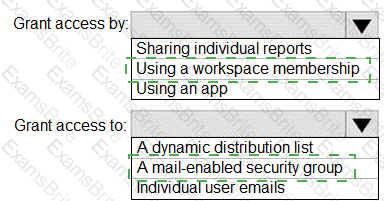
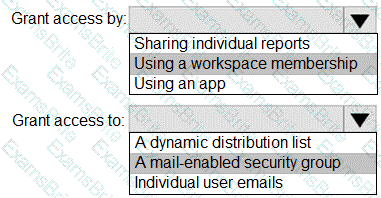
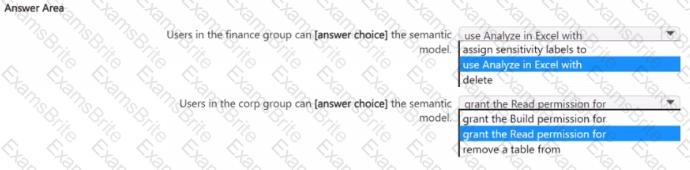
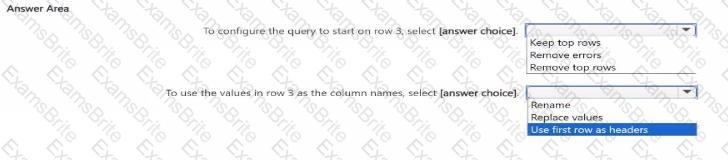
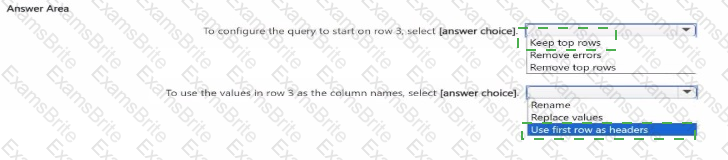
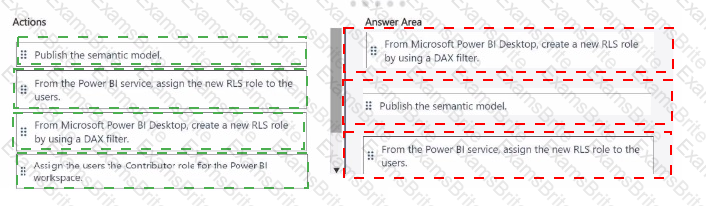
You need to create a solution to meet the notification requirements of the warehouse shipping department.
What should you do? To answer, select the appropriate options in the answer area.
NOTE: Each correct select is worth one point:


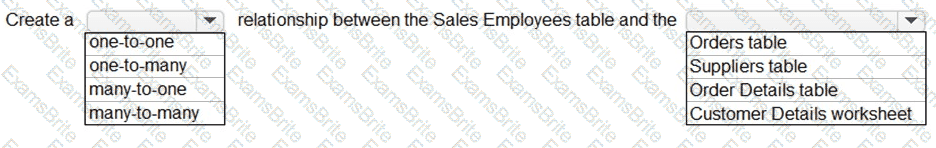
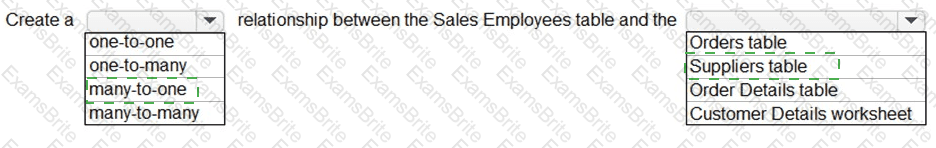
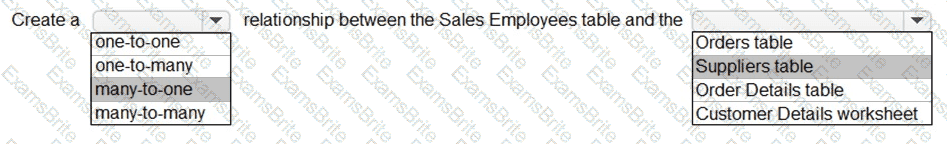
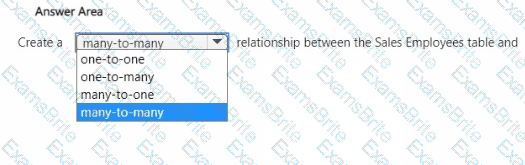
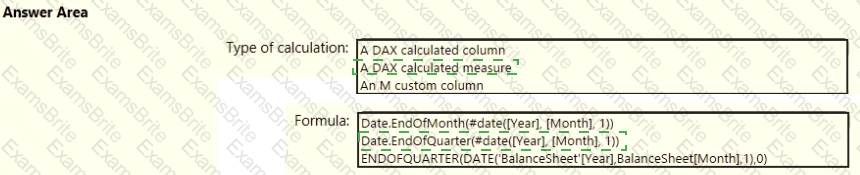
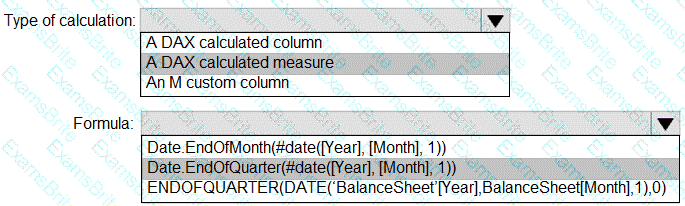
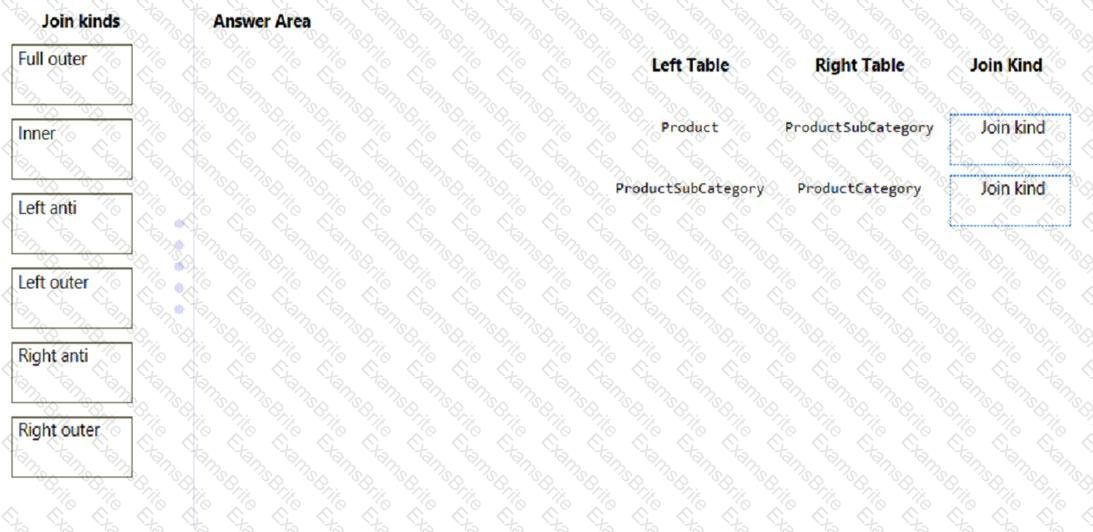
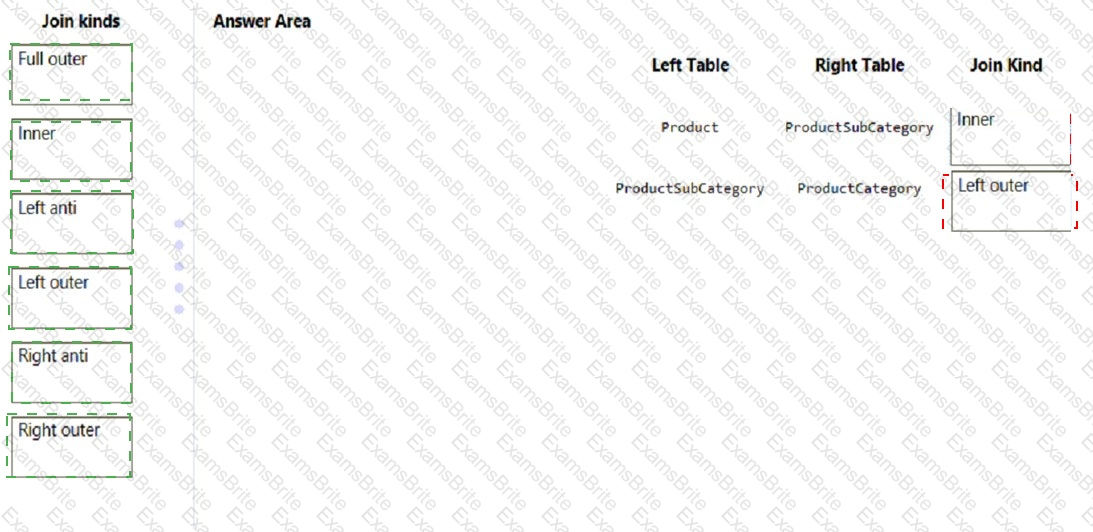
You need to design the data model to meet the report requirements.
What should you do in Power BI Desktop?
A.
From Power Query, use a DAX expression to add columns to the Orders table to calculate the calendar quarter of the OrderDate column, the calendar month of the OrderDate column, the calendar quarter of the ShippedDate column, and the calendar month of the ShippedDate column.
B.
From Power Query, add columns to the Orders table to calculate the calendar quarter and the calendar month of the OrderDate column.
C.
From Power Bl Desktop, use the Auto date/time option when creating the reports.
D.
From Power Query, add a date table. Create an active relationship to the OrderDate column in the Orders table and an inactive relationship to the ShippedDate column in the Orders table.
You need to minimize the size of the semantic model. The solution must meet the report requirements.
What should you do?
A.
Filter out discontinued products while importing the Products table.
B.
Group the Categories table by the CategorylD column.
C.
Change the OrderlD column in the Orders table to the Text data type.
D.
Remove the QuantityPerUnit column from the Products table.
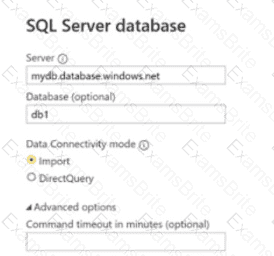
You use Power Query to import two tables named Order Header and Order Details from an Azure SQL database. The Order Header table relates to the Order Details table by using a column named Order ID in each table.
You need to combine the tables into a single query that contains the unique columns of each table.
What should you select in Power Query Editor?
A.
Merge queries
B.
Append queries
C.
Combine files
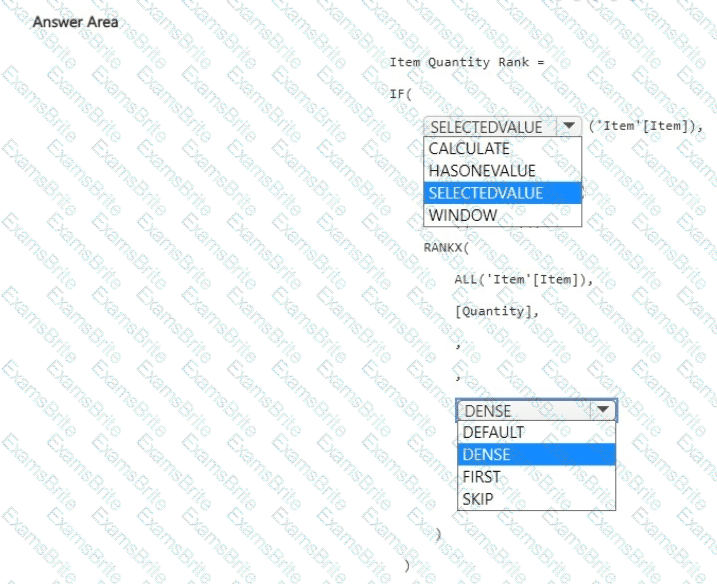
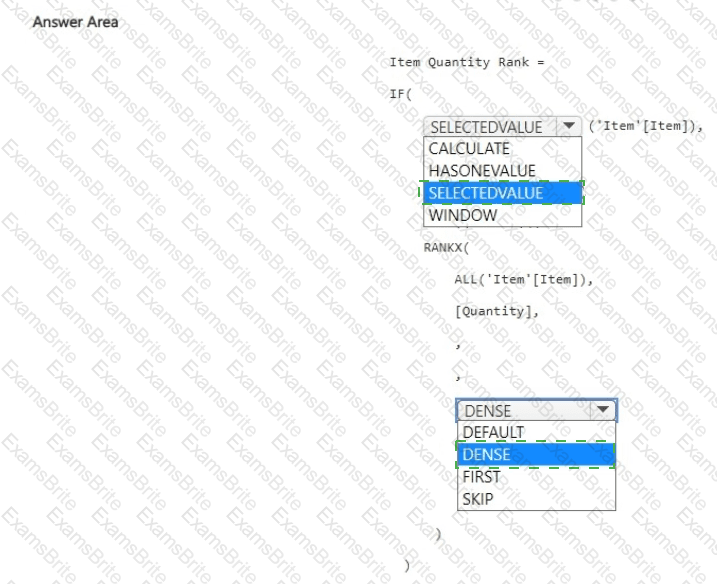
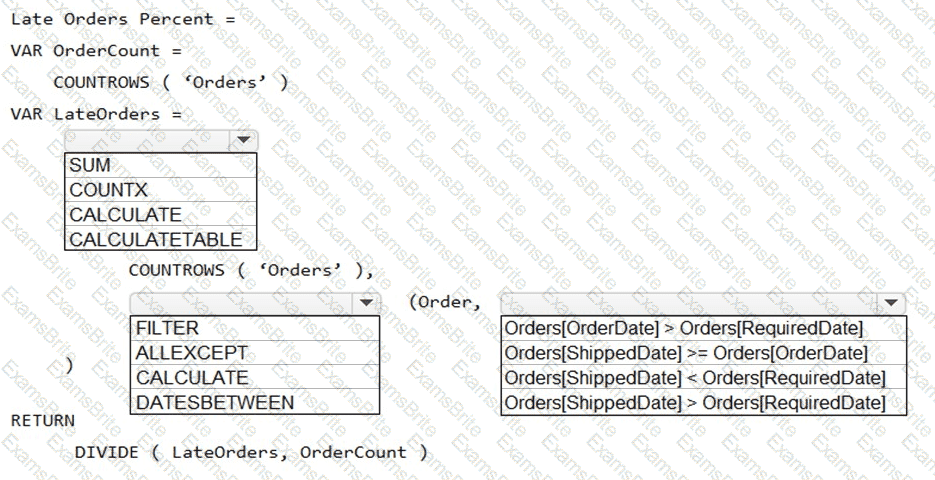
You need to create a measure that will return the percentage of late orders.
How should you complete the DAX expression? To answer, select the appropriate options in the answer area.
NOTE: Each correct selection is worth one point.
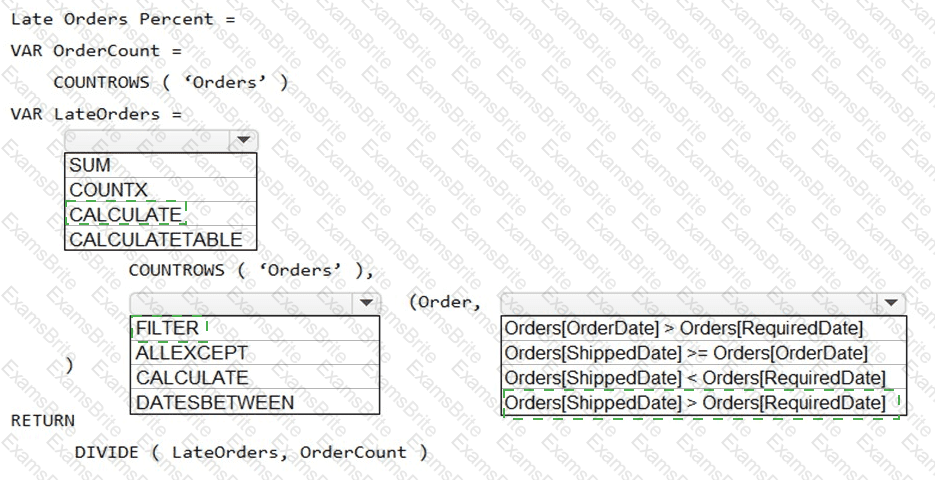
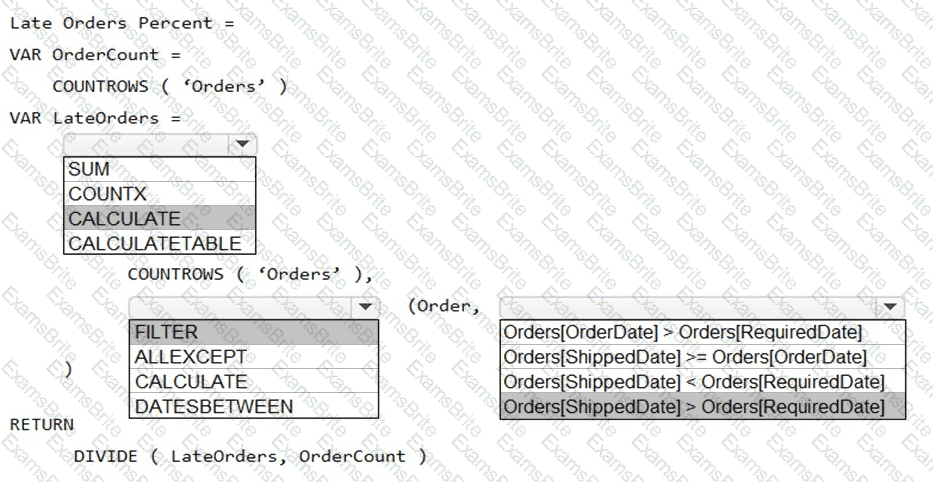
Box 1: CALCULATE
CALCULATE evaluates an expression in a modified filter context.
Syntax: CALCULATE(
Expression - The expression to be evaluated.
filter1, filter2,… (Optional) Boolean expressions or table expressions that defines filters, or filter modifier functions.
Box 2: FILTER
FILTER returns a table that represents a subset of another table or expression.
Syntax: FILTER(