Tableau Desktop Specialist
Last Update Jul 26, 2026
Total Questions : 317
We are offering FREE TDS-C01 Tableau exam questions. All you do is to just go and sign up. Give your details, prepare TDS-C01 free exam questions and then go for complete pool of Tableau Desktop Specialist test questions that will help you more.


Which of the following are valid reasons to use a Tableau Data Extract (.tde) over Live Connections?
True or False: Enabling any other type of sort (Field, alphabetic, or Nested) clears the manual sort we create.
You have a scatter plot visualization.
What should you do to configure the visualization as a density map?
You want to update the font of an entire workbook.
What should you use to configure the default fonts?
For a ____________ sort, no matter how the data changes, the values will always stay in the sort order we kept stuff in.
True or False: Physical tables remain distinct (normalized), not merged in the data source whereas logical tables are merged into a single, flat table.
You are creating a combined axis chart.
Where should you drag the second measure after dragging the first measure to the Rows shelf?
True or False: A LEFT JOIN or INNER JOIN creates a row each time the join criteria is satisfied, which can result in duplicate rows. One way to avoid this is to use data blending instead.
Our use case states that we need to create a set showing the Bottom 10 products by Profit in each Region. Which of the following filter types should you apply on Region?
Skipped Join the Geo Data and Time Series Table on the Item Number ID column, and display the Store count for every State on a Map. What was the Store count in 2017 for Texas (TX)?
Join the Geo Data and Time Series Table on the Item Number ID column, and display the Store count for every State on a Map. What was the Store count in 2017 for Texas (TX)?
Which two statements accurately describe a visualization animation? Choose two
Which of the following are correct ways to define a join in Tableau version 2020.3 and above?
You have the following visualization.
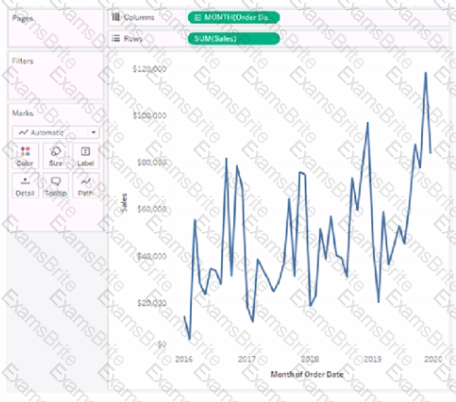
Where should you place a field named Region to show multiple distinct lines on the same axis?
DOWNLOAD THE DATASET FROM: https://drive.google.com/drive/folders/1WXzqsrNmXVdmQ-574wld4InEplyKT8RP?usp=sharing (if you haven't already)
Using the cwurData table, plot a Map to see which country had the Second highest number of patents in the Year 2013?
Which chart type uses automatically generated sizes that cannot be resized by using the Marks card?
You want to add Custom shapes to your visualisation. Where can you add these new shapes?
Which of the following are interactive elements that can be added to a dashboard for users?
Which of the following is the correct way to calculate Profit Ratio in Tableau?
A field that shows average home values for the United States in 2016 is most likely :
You need to display the complete list of potential data connections when you connect to a server. What action should you perform?
You need to create a calculation that returns a customer name followed by a comma, a space, and then the customer's age (for example: John Doe, 32).
What should you include in the calculation?
You can use the __________________ in Tableau to clean / organise your data.
________________ is hosted by Tableau to share our visualisations publically with the world.
You clicked Sheet 1 from the data source page, and now you have opened the Tableau Desktop workspace as shown above. What is the main thing that you do here?
Using the Geo Data Table, create a Map showing Sales made per State. For the State of New York (NY), what was the amount in Sales ($) made for Phone Assortments with White color?
Using the Time Series table, create a chart that shows the percent difference in Average Inventory on Hand for each Assortment by year and quarter.
How many quarters did the Electronics Assortment show a negative percent difference in the Average Inventory On Hand?
Tableau auto-generates ____________ dimension(s) and _____________ measure(s) for us
To customize links based on the data in your dashboard, you can automatically enter field values as _______________ in URLs
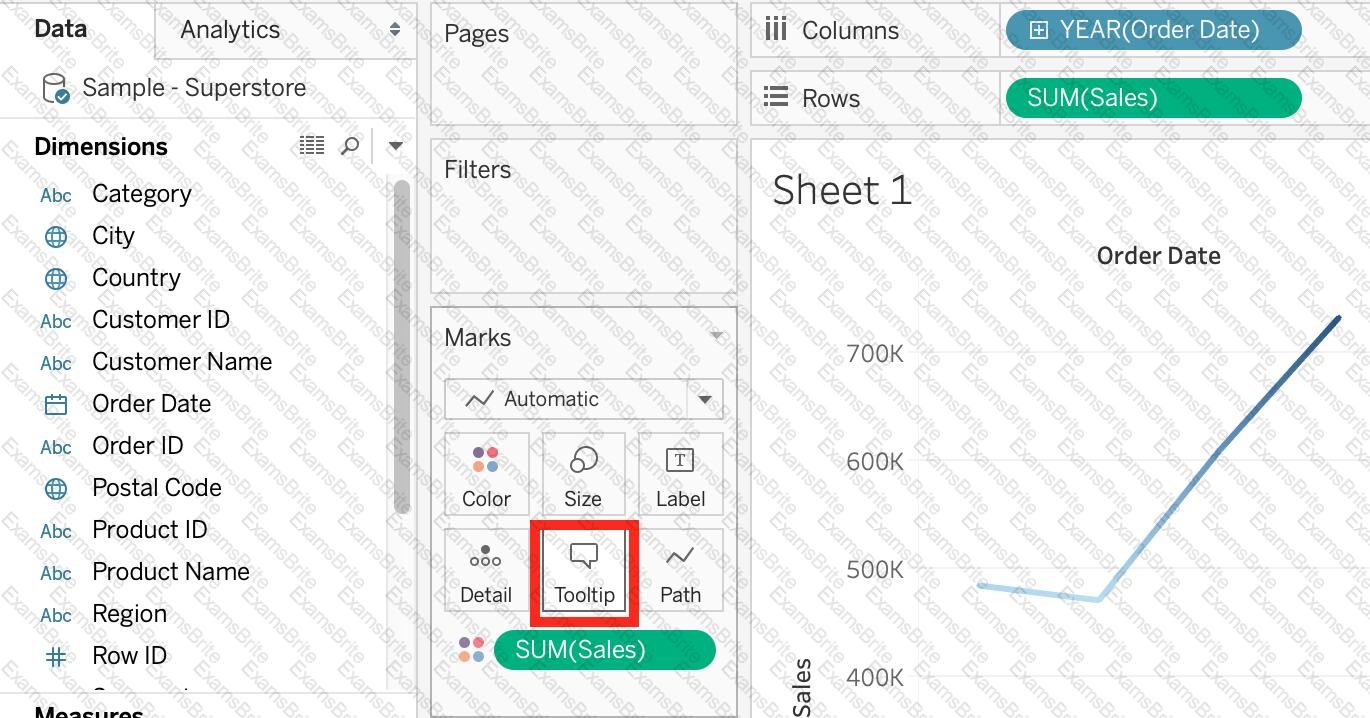
Which of the following are valid ways to Bold the Tooltip content in Tableau?
Which action describes the process for changing a measure so that it automatically aggregates an average instead of a sum?
The default path for all supporting files, data sources, icons, logs etc is in ______________________
In order to avoid any confusions, what should you do after creating a Dual-axis chart?
What is the minimum amount of RAM recommended for any production use of Tableau Server?
You view the relationship canvas shown in the following exhibit.
What does Migrated Data indicate?
What are two correct methods to change the data type of a field? Choose two.
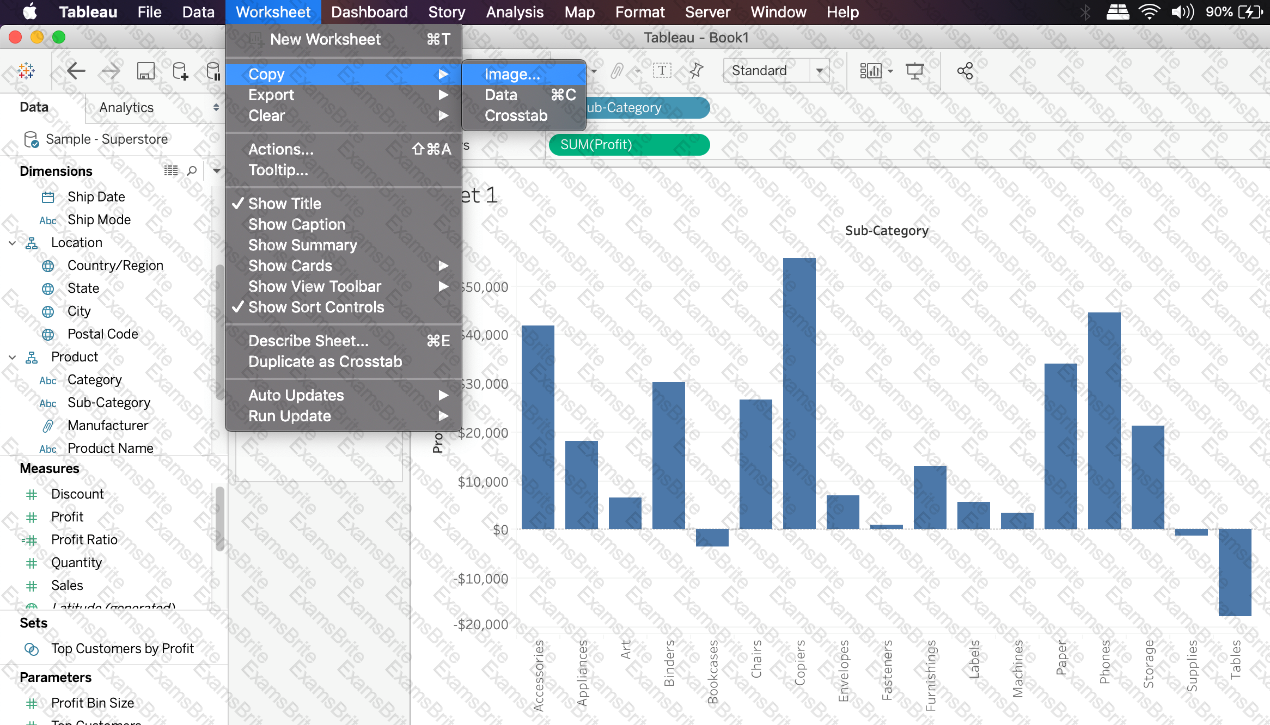
When exporting a worksheet as an image in Tableau, which of the following file formats are available?
You want to save a view as an image that you can paste into a Microsoft Word document. Which two statements accurately describe exporting a view as an image? Choose two.
If you see the following Filter, then you're working with _______________________
Larger image
You have a visualization that uses multiple types of sorting.
How can you clear all sorting of the visualization?
Which of the following are valid ways to copy a worksheet visualisation as an image?
Which two actions can you perform when you join tables from multiple connections? Choose two.
What statement correctly describes a requirement to create a reference line in Tableau?
You create the following visualization.
What is the first step to create the visual grouping of the 10 marks shown in blue?
Is it possible to add both a Dashboard and a Worksheet at the same time to a Story Point in Tableau?
When using Animations in a Tableau, which of the following is the default duration for animations?
You have a bar chart that has a dimension on the Columns shelf and a measure on the Rows shelf.
How can you make a stacked bar chart?
Which two options can you use to change the device layout of a dashboard? Choose two.
Is it possible to deploy a URL action on a dashboard object to open a Web Page within a dashboard rather than opening the system’s web browser?
What is the one most important thing you should do after creating a Dual-axis chart?
Create a Set containing Customer Names whose Sales are GREATER than 30,000. Which customer had the LEAST sales in this set?
Which statement accurately describes creating a group by selecting headers in a view?
You create a dashboard that tracks your teams progress on various projects. On the dashboard, you want to display your company's web page. Which dashboard element should you use?
You need to uniformly change the size for all marks in a view.
What should you do?
Relationships are represented by __________________ and operate at the ____________________.
What is the default behavior of Tableau when you add a measure to the view?
Which of the following are valid ways to export a dashboard with multiple visualisations as an image?
A _____________ action is a hyperlink that points to a web page, file, or other web-based resource outside of Tableau.
Is it possible to use measures in the same view multiple times (e.g. SUM of the measure and AVG of the measure)?
Tableau will automatically create a hierarchy for which two kinds of data? Choose two.
Which of the following charts types always includes bars sorted in descending order?
Using the dataset, plot a Map showing all the countries, filtered by Market to only include LATAM. Which country in the LATAM Market has the highest shipping delay (sum of total number of days between the order date and the ship date)?
To connect Tableau to a CSV data source what type of connection should you use?
Which of the following are valid options to define the scope of a reference line? Choose 3.
Suppose you have a bar chart. When we group by labels in a view, which of the following happens?
What is created by a calculated field that has a formula of SUM(Sales)/SUM(Profit)?
Using the dataset, create a bar chart showing the average Quantity broken down by Region, and filtered by Country to only show Japan. What was the average Quantity in the State of Tokyo?
Using the Time Series table, create a cross-tab showing sales for each Assortment broken down by Year and Quarter. In Q4 of October 2017, what was the Average sales amount for the Hardware assortment?
Question 30: Skipped
Using the CoffeeChain table, create a scatter plot of Profit (x-axis) vs Sales (y-axis) broken down by State. Add a Linear trend line to the view. What is its R-squared value?

TESTED 26 Jul 2026
 Graphical user interface, application
Description automatically generated
Graphical user interface, application
Description automatically generated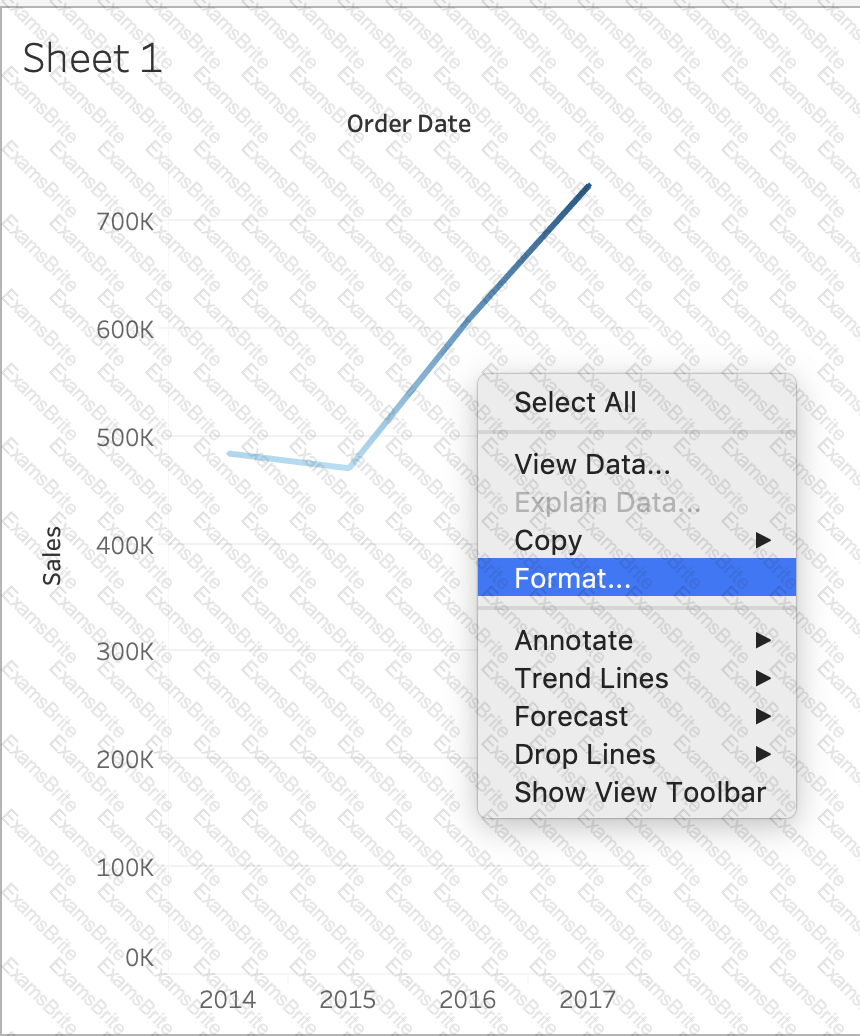 A picture containing line chart
Description automatically generated
A picture containing line chart
Description automatically generated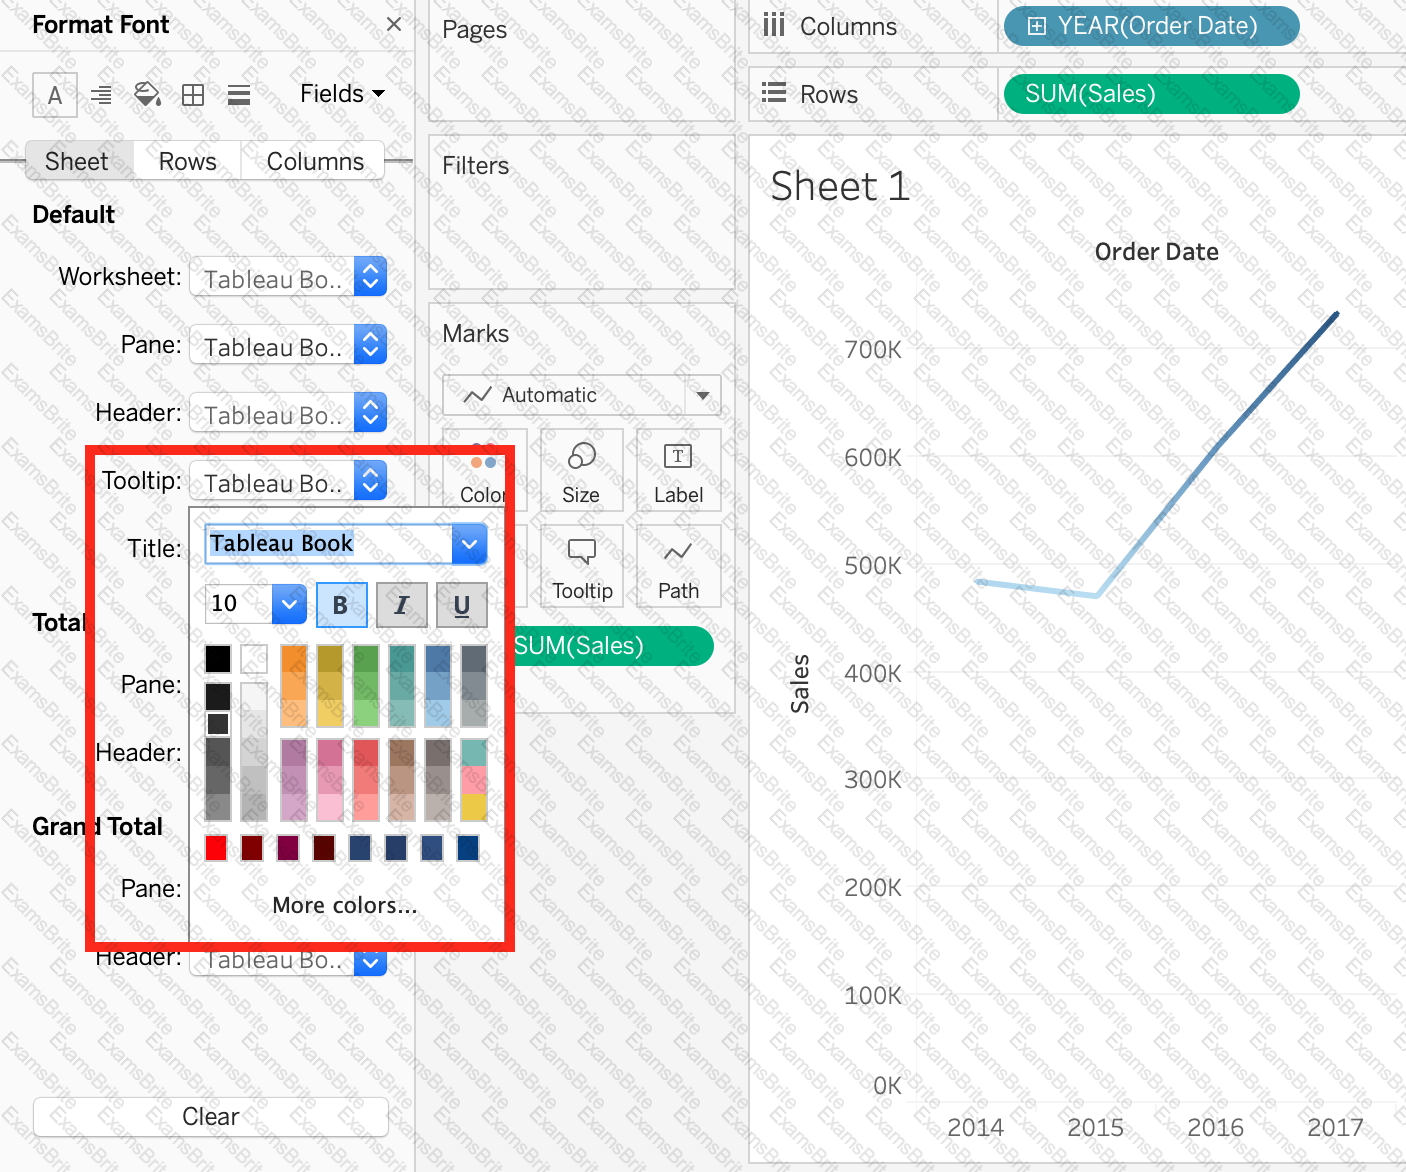 Graphical user interface
Description automatically generated
Graphical user interface
Description automatically generated