Applied Probability and Statistics (FZO1 C955)
Last Update Sep 20, 2026
Total Questions : 155
We are offering FREE Applied-Probability-and-Statistics WGU exam questions. All you do is to just go and sign up. Give your details, prepare Applied-Probability-and-Statistics free exam questions and then go for complete pool of Applied Probability and Statistics (FZO1 C955) test questions that will help you more.



A commuter has a .4 probability of taking the bus to work, a .4 probability of driving a car, and a .2 probability of cycling. The probability of being late is .15 when taking the bus, .05 when driving a car, and .1 when cycling.
What is the probability of taking the bus and being on time, or driving a car and being on time?
The average lifespan of a dalmatian is 11.5 years, with a standard deviation of 1.5 years.
What are the two values between which 95% of the data falls for the average lifespan of a dalmatian, assuming a normal distribution?
A hospital analyzes the recovery rates of patients undergoing two different treatments for a specific condition. Treatment X has an overall recovery rate of 80%, while Treatment Y has a recovery rate of 90%. However, when the data is divided by age groups, Treatment X has a higher recovery rate in each age group compared to Treatment Y.
Is Simpson’s paradox present in this study?
In a class of 40 students, the following data were collected on their favorite sport:
Soccer: 10 students
Basketball: 15 students
Tennis: 5 students
Swimming: 10 students
What is the relative frequency of students whose favorite sport is not basketball?
A 10-sided die is rolled in a role-playing game.
What is the probability of rolling a number that is a multiple of 2 or greater than 7?
A single ball is drawn from an opaque bag that contains red, blue, and green balls. The probability of drawing a red ball is .3, and the probability of drawing a blue ball is .6.
What is the probability of drawing a green ball?
In a city’s public transportation system, the distribution of commuters by mode of transport is as follows: 40% use buses, 25% use trains, 20% use bicycles, 10% walk, and 5% use other means of transportation.
What is the probability that a randomly selected commuter uses either a bus or a train?
A teacher plots the test scores of a class using the box plot.
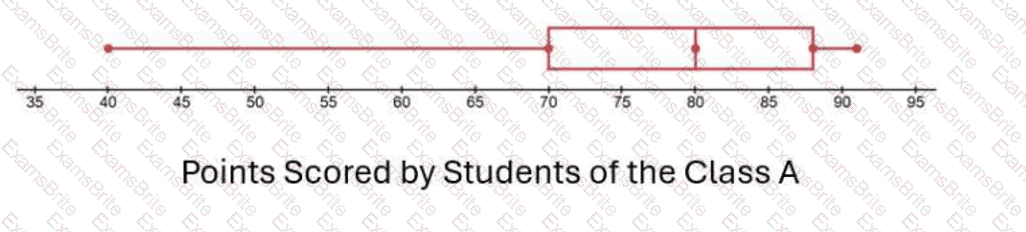
What is the interquartile range?
In a class of 30 students, 18 are enrolled in a math course, and 12 are enrolled in a science course. Among the students enrolled in the science course, 8 are also enrolled in the math course.
What is the probability that a student is enrolled in the math course given that they are enrolled in the science course?
A road safety research group wants to enhance road safety by analyzing the stopping distance of a car at different speeds. The group has recorded their data in the following scatterplot.
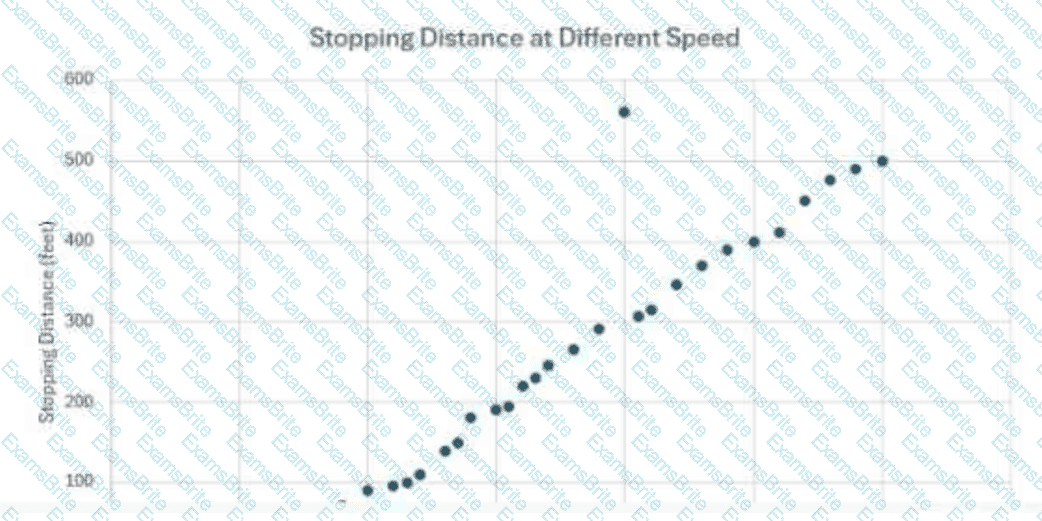
What is true about the outlier in the scatterplot?
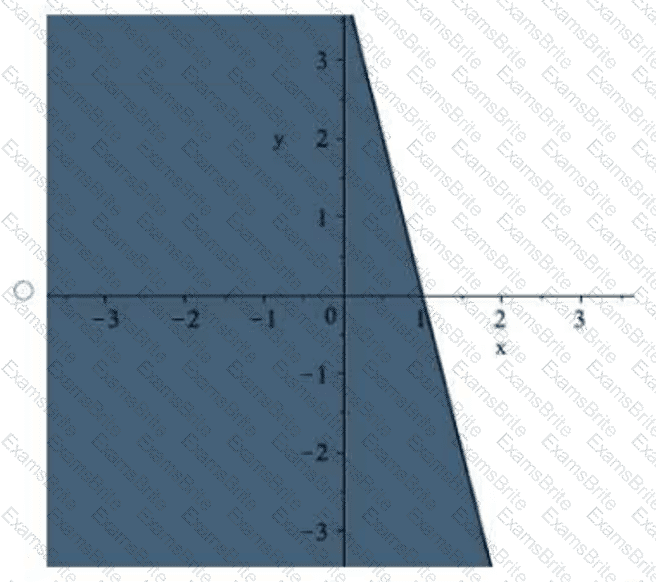
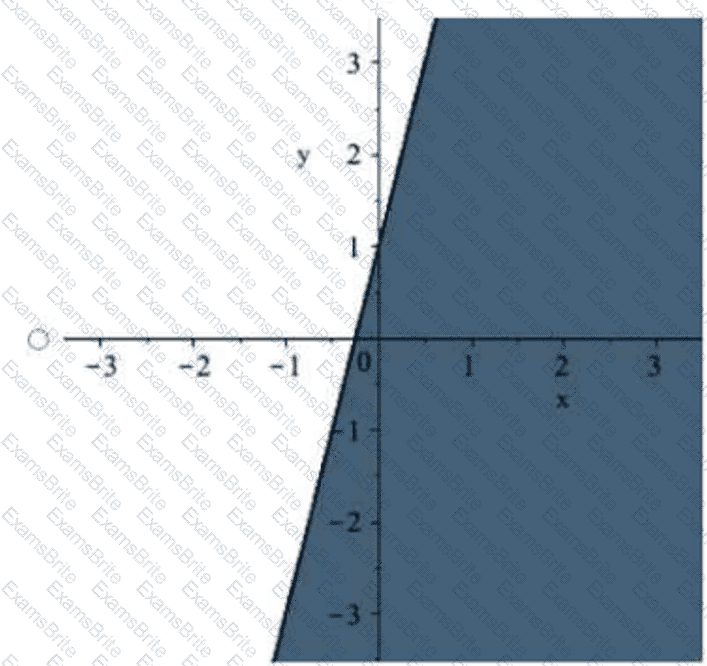
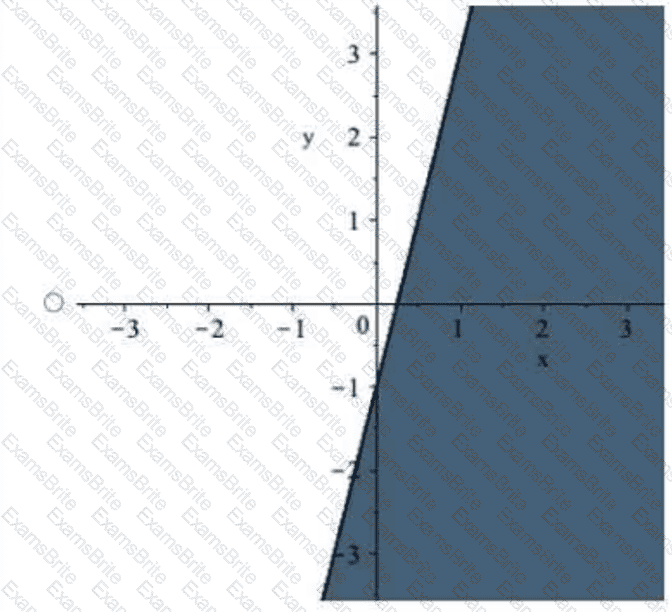
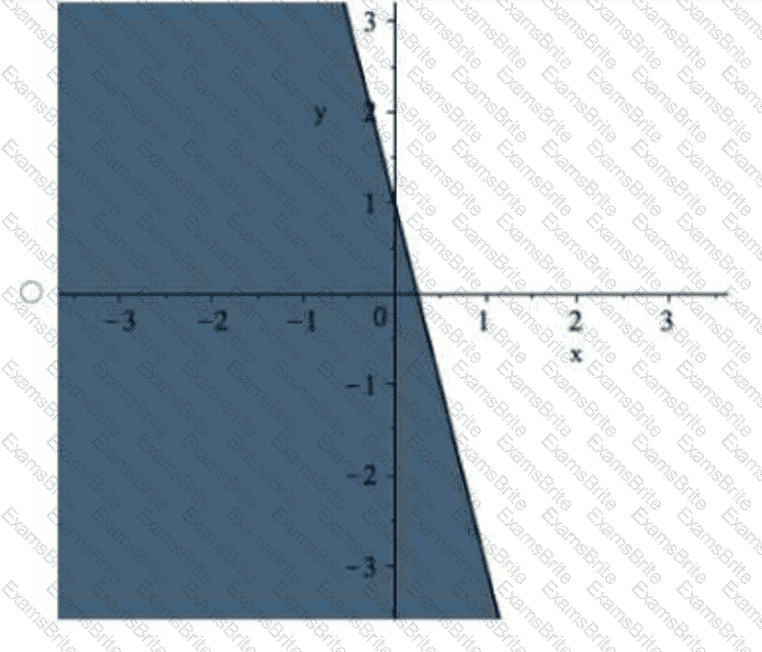
Review the following inequality:
y ≤ −4x + 1
Which shaded region is described by this inequality?
A university surveys faculty and students to determine support for a new campus recycling initiative.
The results of the survey are shown in the following 2 × 2 contingency table:

Which statement is true?
Given a normal distribution with a mean of 40 and a standard deviation of 6, what is the range that contains approximately 95% of the data?

TESTED 20 Sep 2026