WGU Applied Algebra FXO2 PFXP C957
Last Update Sep 20, 2026
Total Questions : 142
We are offering FREE Applied-Algebra WGU exam questions. All you do is to just go and sign up. Give your details, prepare Applied-Algebra free exam questions and then go for complete pool of WGU Applied Algebra FXO2 PFXP C957 test questions that will help you more.



A company provides internet service to approximately 1,050 customers each year. The table shows the percentage of customers with fiber internet each year since 2020.
Years since 2020 Percent of Customers with Fiber
0 19
1 28
2 40
3 57
What was the approximate number of customers with fiber internet in 2023?
The spread of two viruses within a single population is modeled using the functions in the graph.
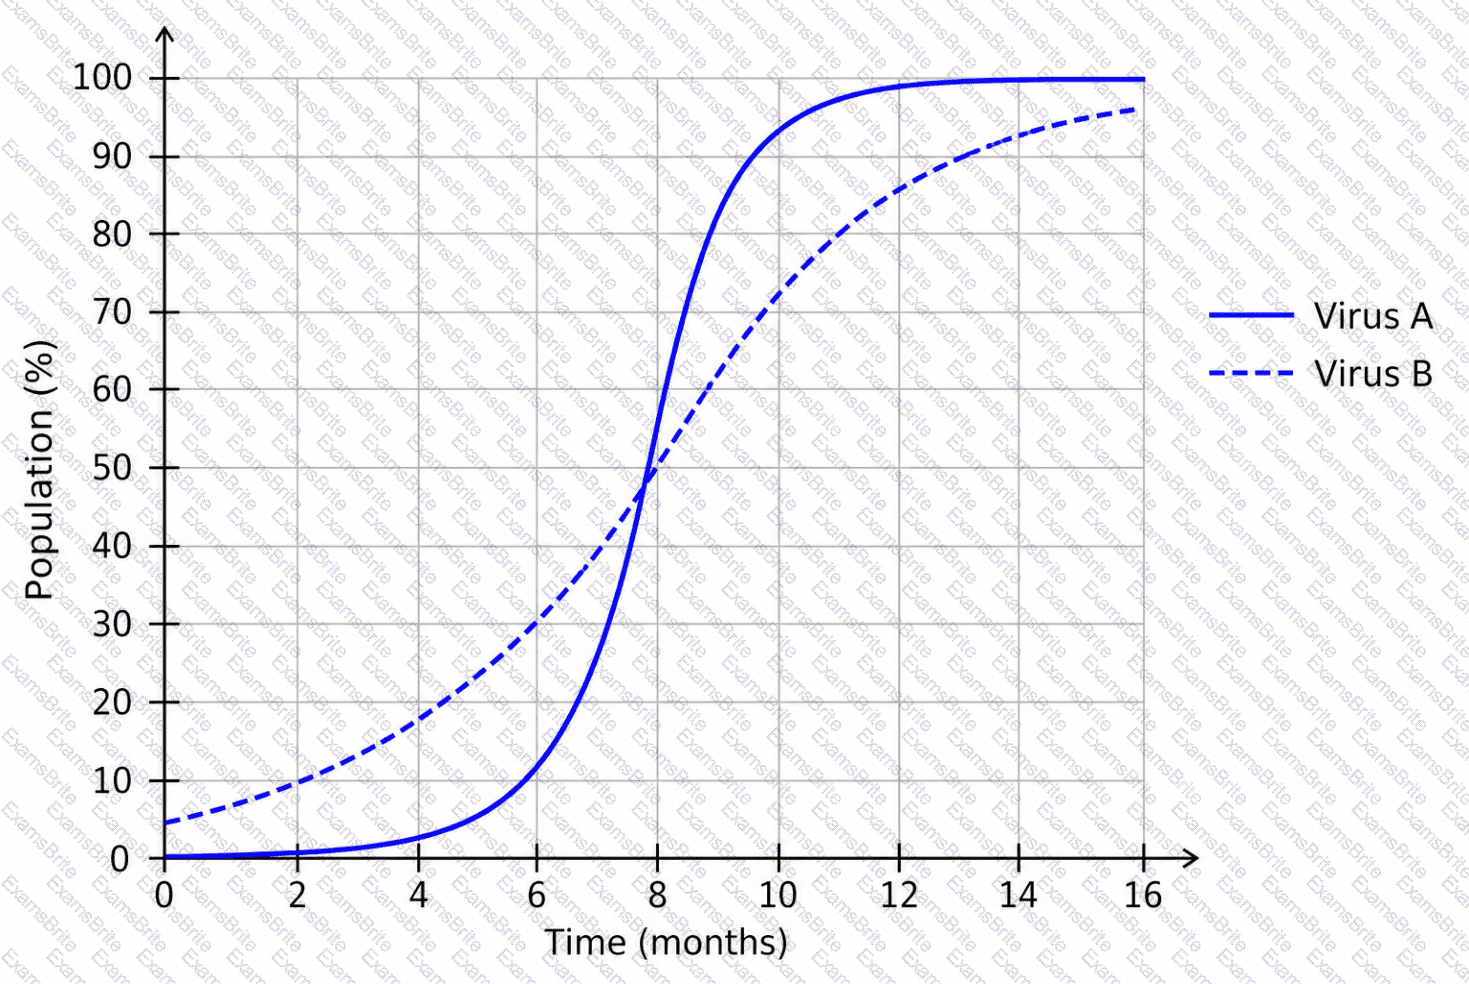
What is a correct conclusion based on the graph?
The scatterplot shows data on the popularity of a blog post over time. The graphed regression function has an r
2
value of 0.42.
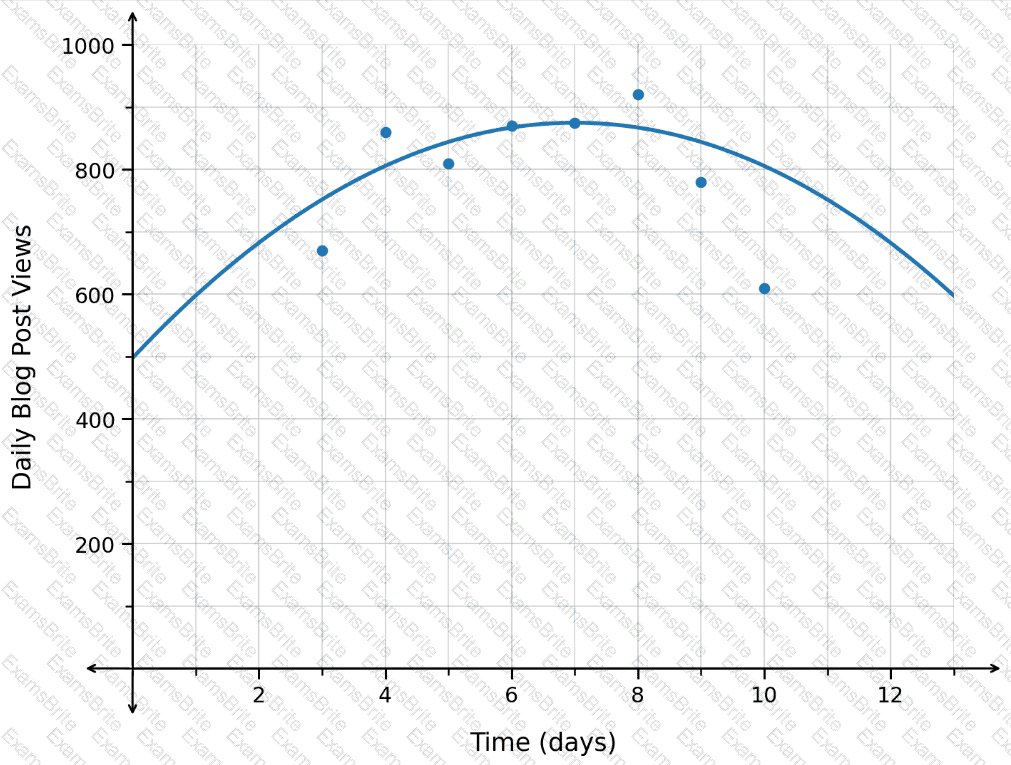
Is it appropriate to make a prediction for the number of daily blog post views after 12.4 days?
The logistic function f(x), whose graph is shown, models the number of registrants for an academic conference, where x represents the number of weeks since registration opened and f(x) represents the number of registrants.
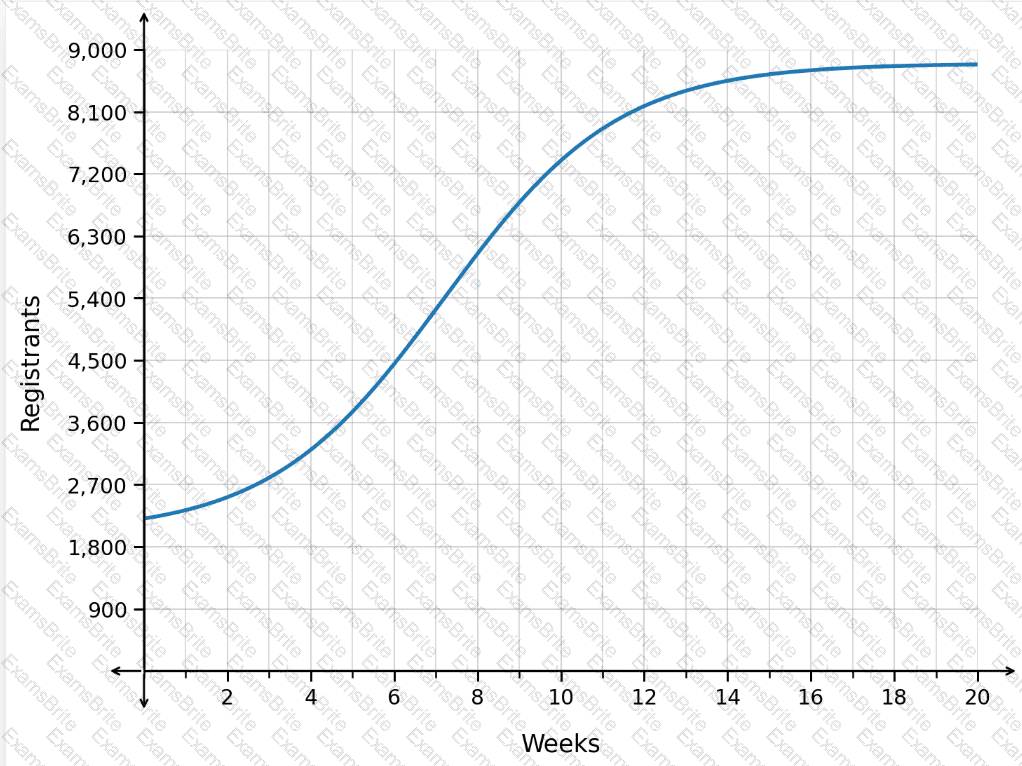
How does the number of registrants change as time progresses from week 1 to week 7?
The spread of two viruses within a single population is modeled using the functions in the graph.
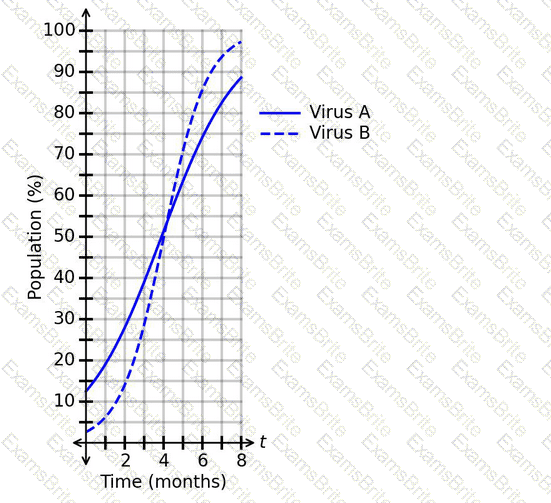
What is a correct conclusion based on the graph?
The number of wild horses in a federal park is represented by the logistic function f(x), whose graph is shown, where xrepresents the number of years since the park was established and f(x)represents the wild horse population in a given year.
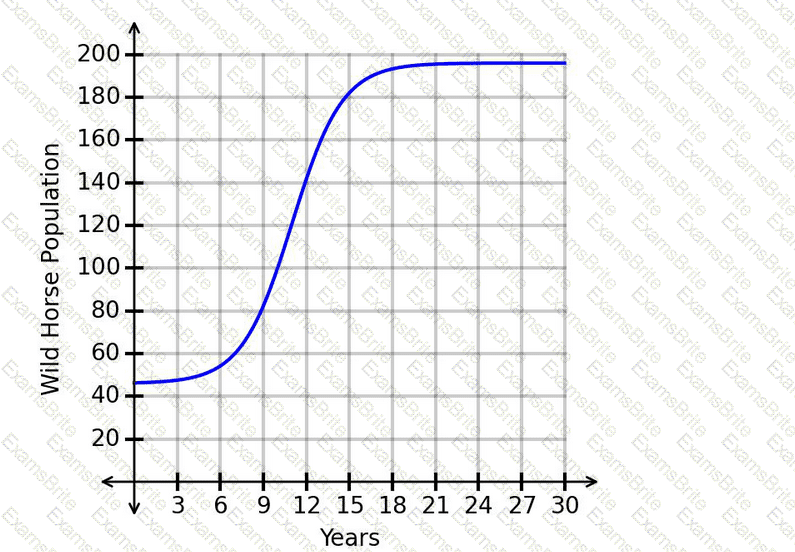
How does the number of wild horses change as time progresses from year 1 to year 9?
The number of registered voters in a district is modeled by a decreasing exponential function, where x represents the number of years since 2005 and f(x) represents the number of registered voters.
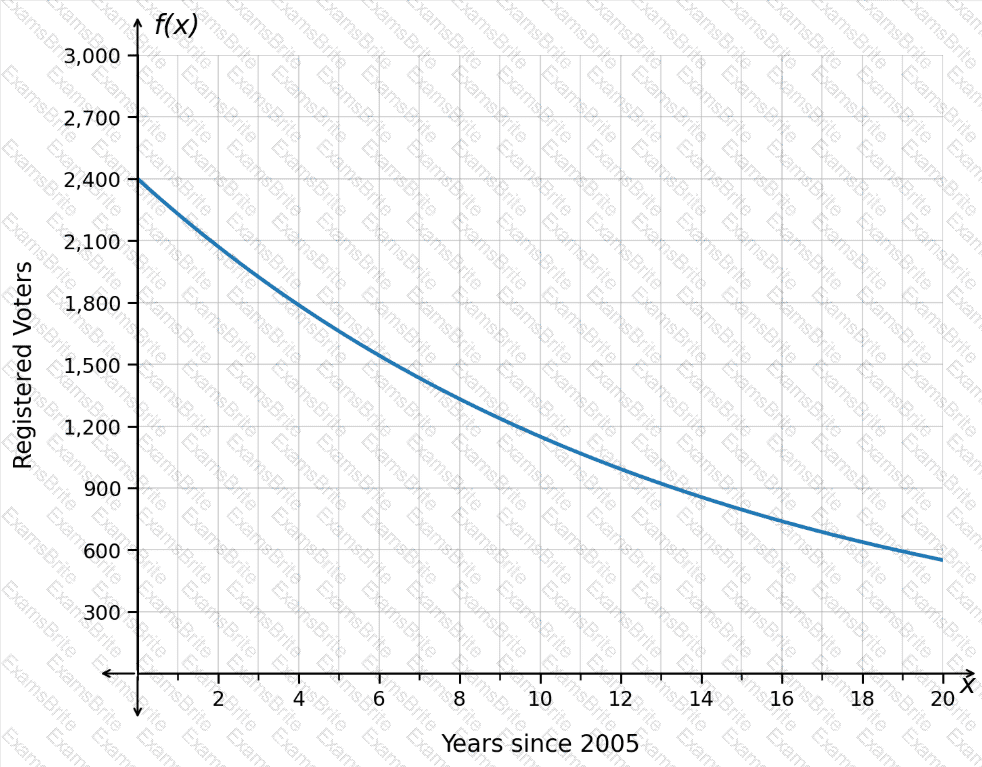
Which interval is associated with the slowest average decrease in the number of registered voters?
The data in the scatterplot represents the number of monthly train crossings at a particular intersection over time.
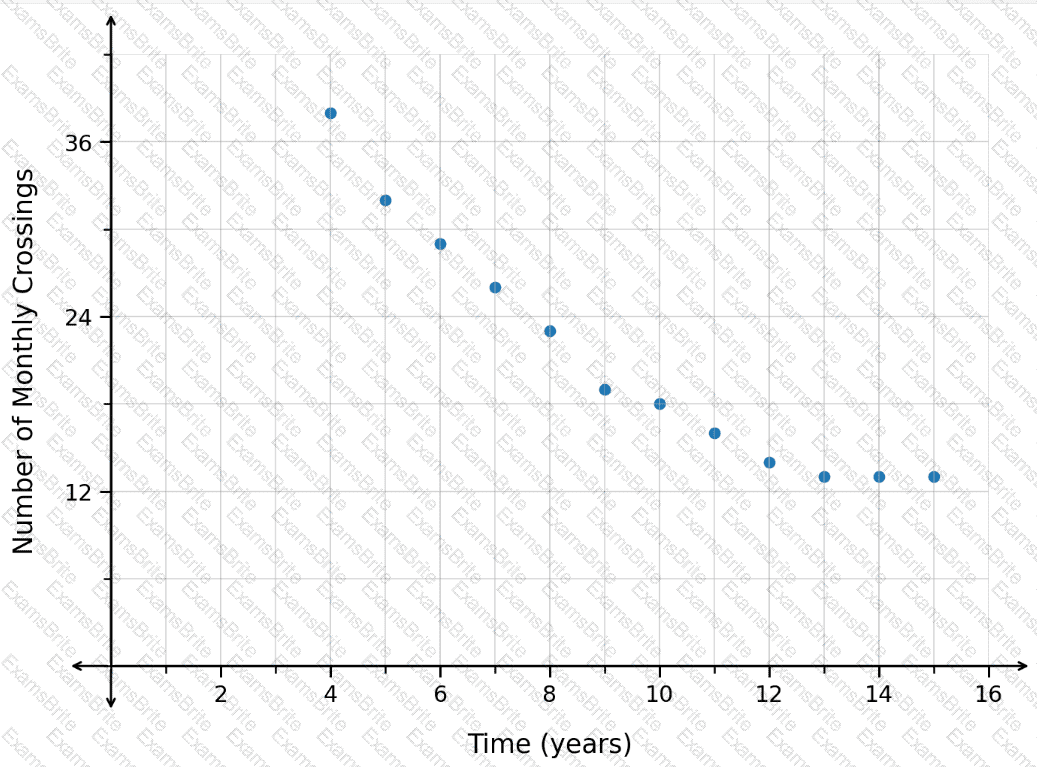
Which type of function should be used to model the data?
A researcher collected data on the average number of product returns per month to a company over time. The results are shown in the scatterplot. The graphed regression function has an r
2
value of 0.45.
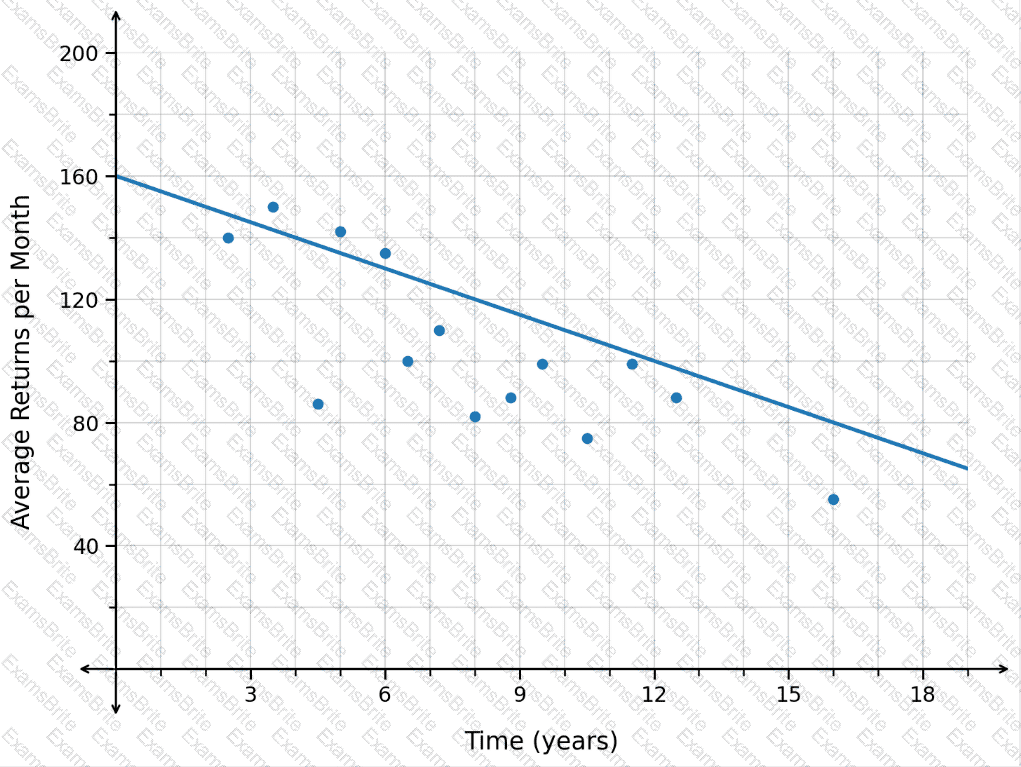
Which range of x-values is appropriate for extrapolation?
The traffic flow on a roadway after 8:00 a.m. is modeled by the graphed exponential function.
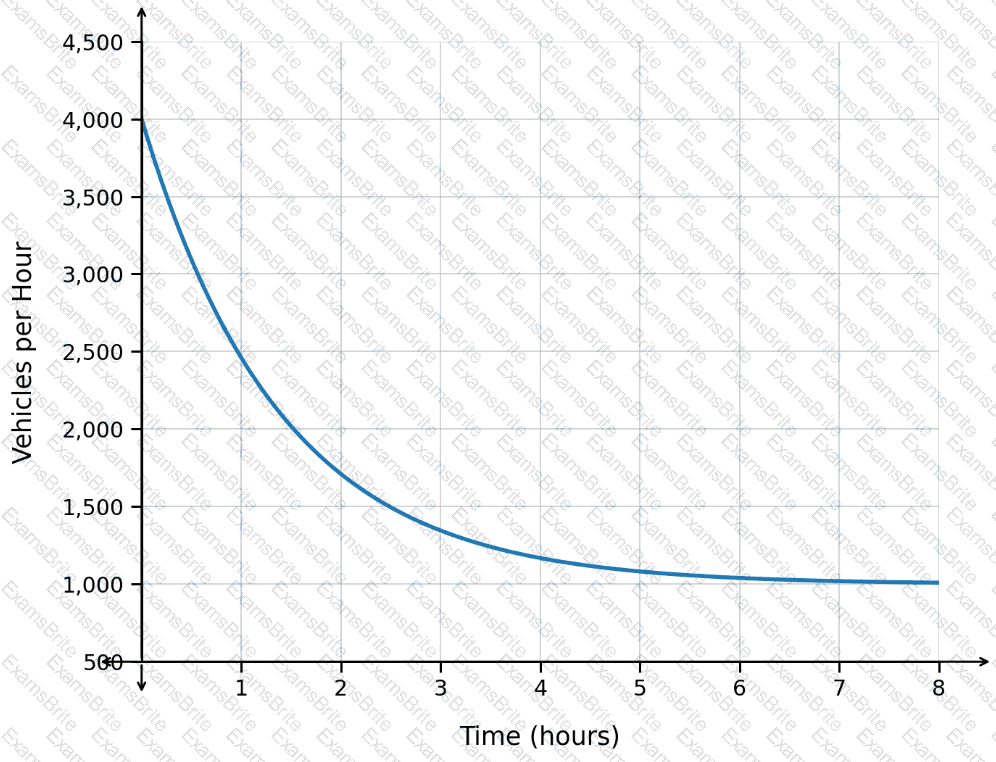
Which conclusion is valid, based on the horizontal asymptote?
The graph shows the weekly profit in hundreds of dollars for a coffee shop. The horizontal axis represents the number of years since the coffee shop opened.
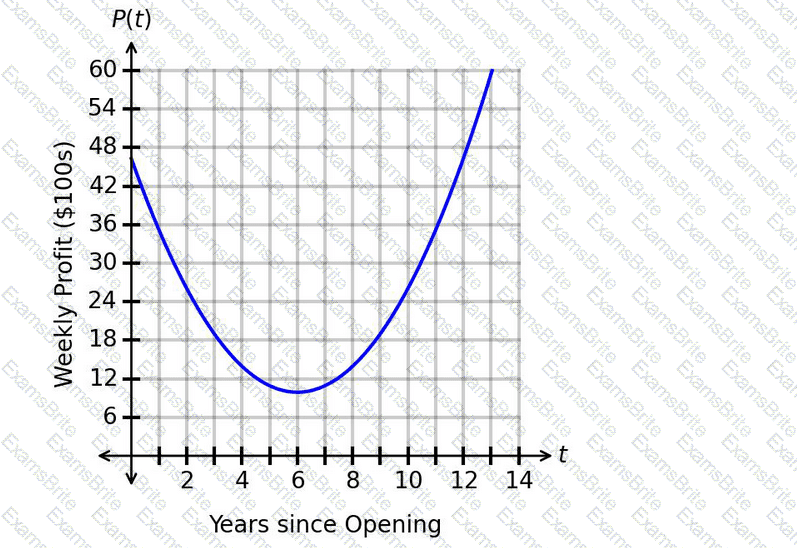
What is the correct interpretation of the minimum value?
A set of data was gathered and used to create a model for the number of subscribers to a blog. The function model is
f(x)=190× 〖 0.99 〗 ^x
where xrepresents the number of years since 2003 and f(x)represents the number of subscribers.
What is the correct interpretation of the average rate of change of the number of subscribers from 2012 to 2015? Round to the nearest whole number, if necessary.
A recipe calls for a constant ratio of water and lemon juice. The graph shows the relationship between the amounts of these two ingredients, where wis the volume of water and lis the volume of lemon juice.
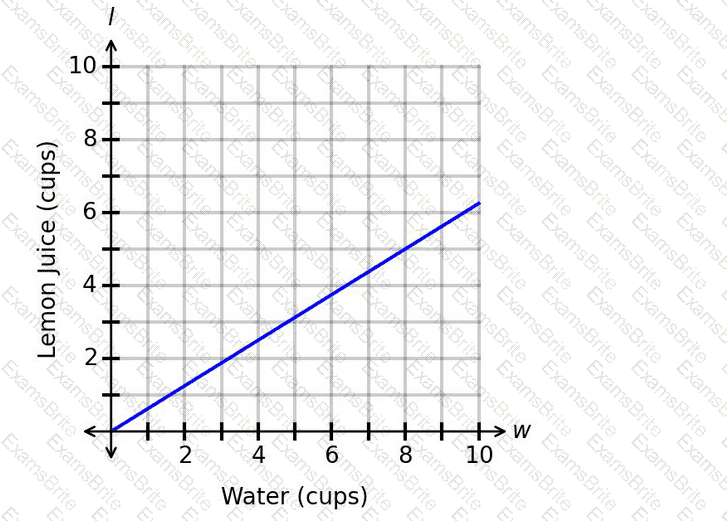
What is the correct interpretation of the rate of change?
In the following graph showing the elevation profile, F(d), for a mountain biking course, the horizontal axis shows the number of miles since the start of the course and the vertical axis shows the elevation in feet.
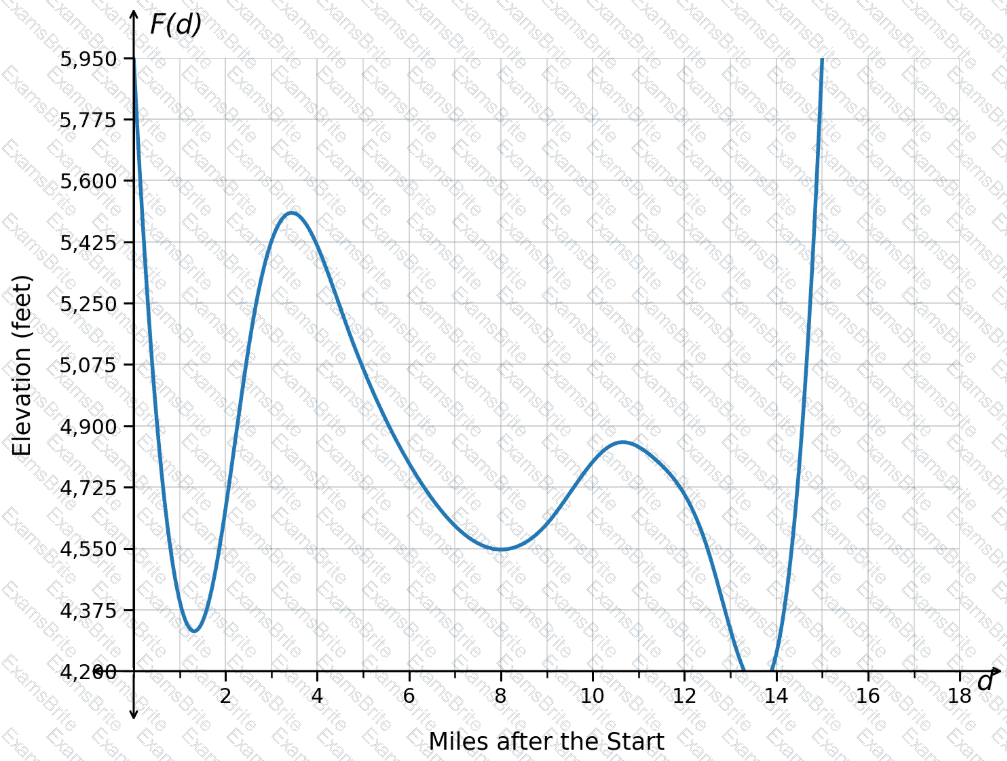
How can the concavity be described from d=10 to d=13.1?
The exponential function
f(t)=2900(1.13)
t
represents the size of a bacteria population, where t is the time in hours.
How many bacteria are in the population when t=18?
The value of an investment portfolio after x years is modeled by the function
g(x)=3100(1.059)
x
.
What is the value of the portfolio when x=10?
The number of tasks completed by computer B is 12 more than the number of tasks completed by computer A. Let F(x)represent the relationship between the number of tasks completed by the two computers, where xis the number of tasks completed by computer A and Fis the number of tasks completed by computer B.
Which function represents this situation?
The number of property sales in a region this year is expected to be 6 less than the number of property sales in the region last year. The function H(x)represents the number of property sales this year, where xrepresents the number of properties sold last year.
Which notation represents the number of property sales this year, given that the number of properties sold last year was 330?
The number of comments on a social media post is represented by the logistic function f(x), whose graph is shown, where xrepresents the number of days since the post was created and f(x)represents the number of comments on day x.
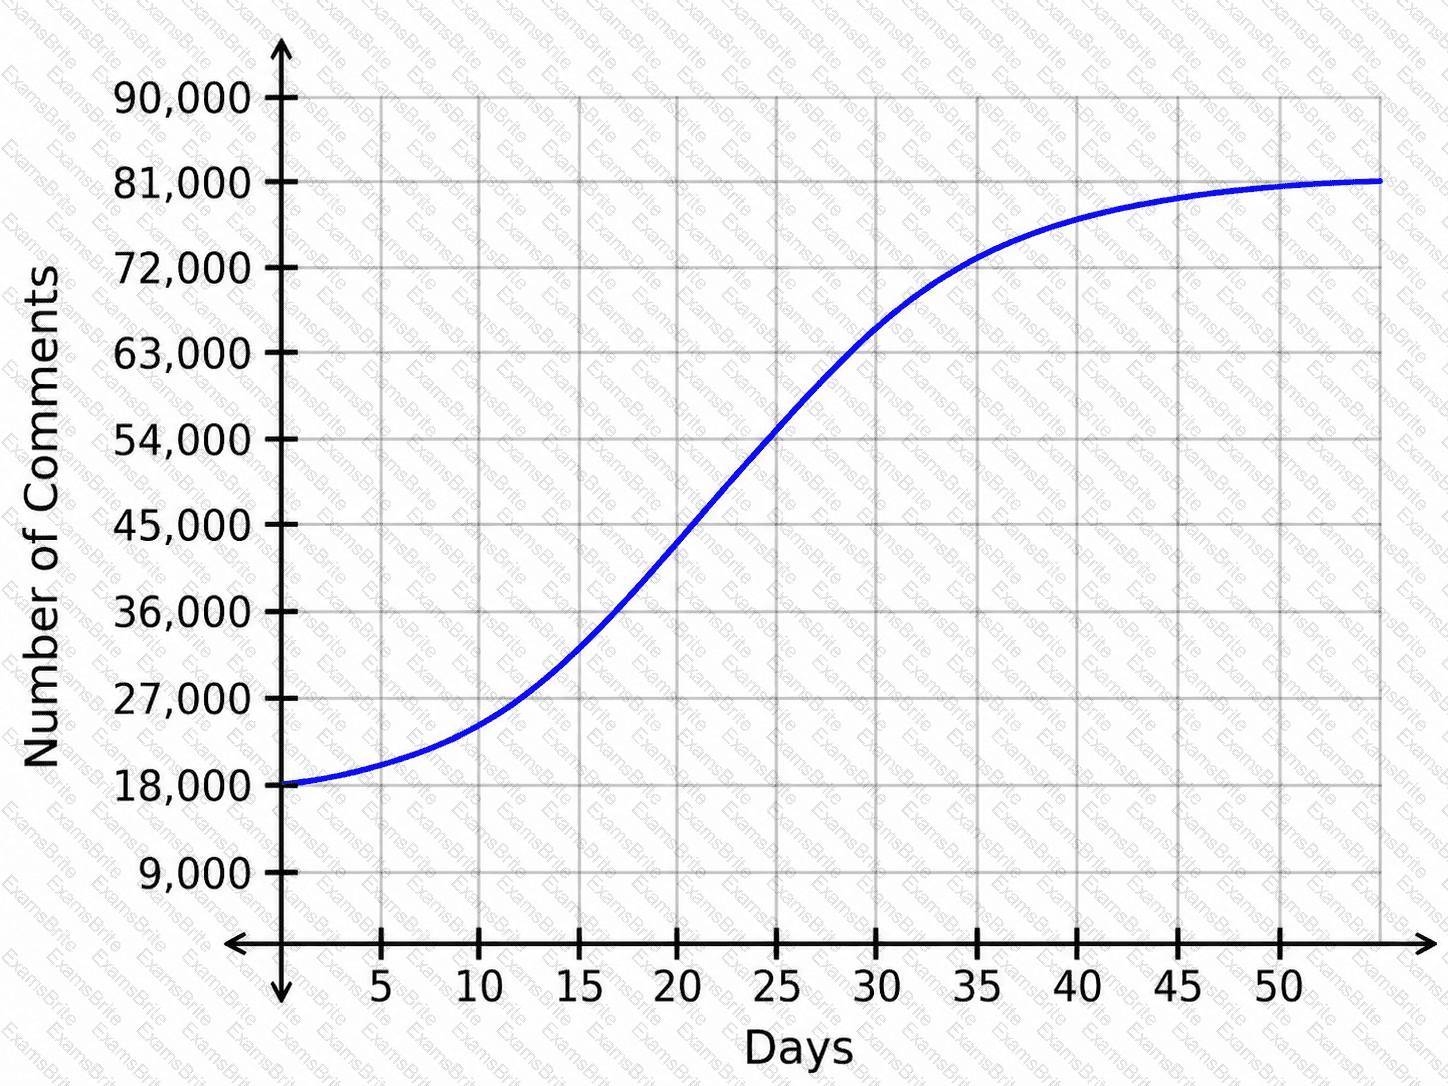
How does the number of comments change as time progresses from day 1 to day 17?
Based on collected data, the number of employees at a firm can be modeled using the function
f(x)=10× 〖 1.09 〗 ^x
whose graph is shown, where xrepresents the number of years since 2001 and f(x)represents the number of employees, in thousands.
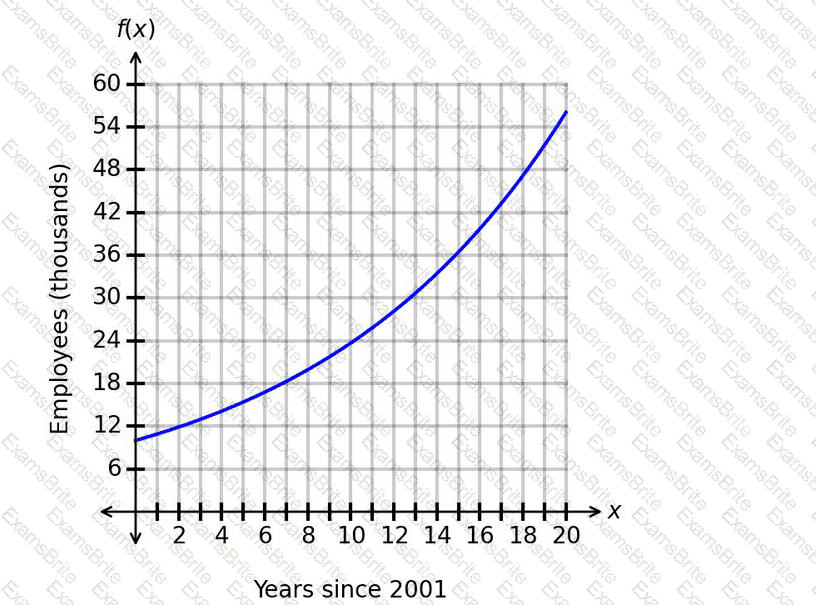
Which time period has the fastest average increase in the number of employees?
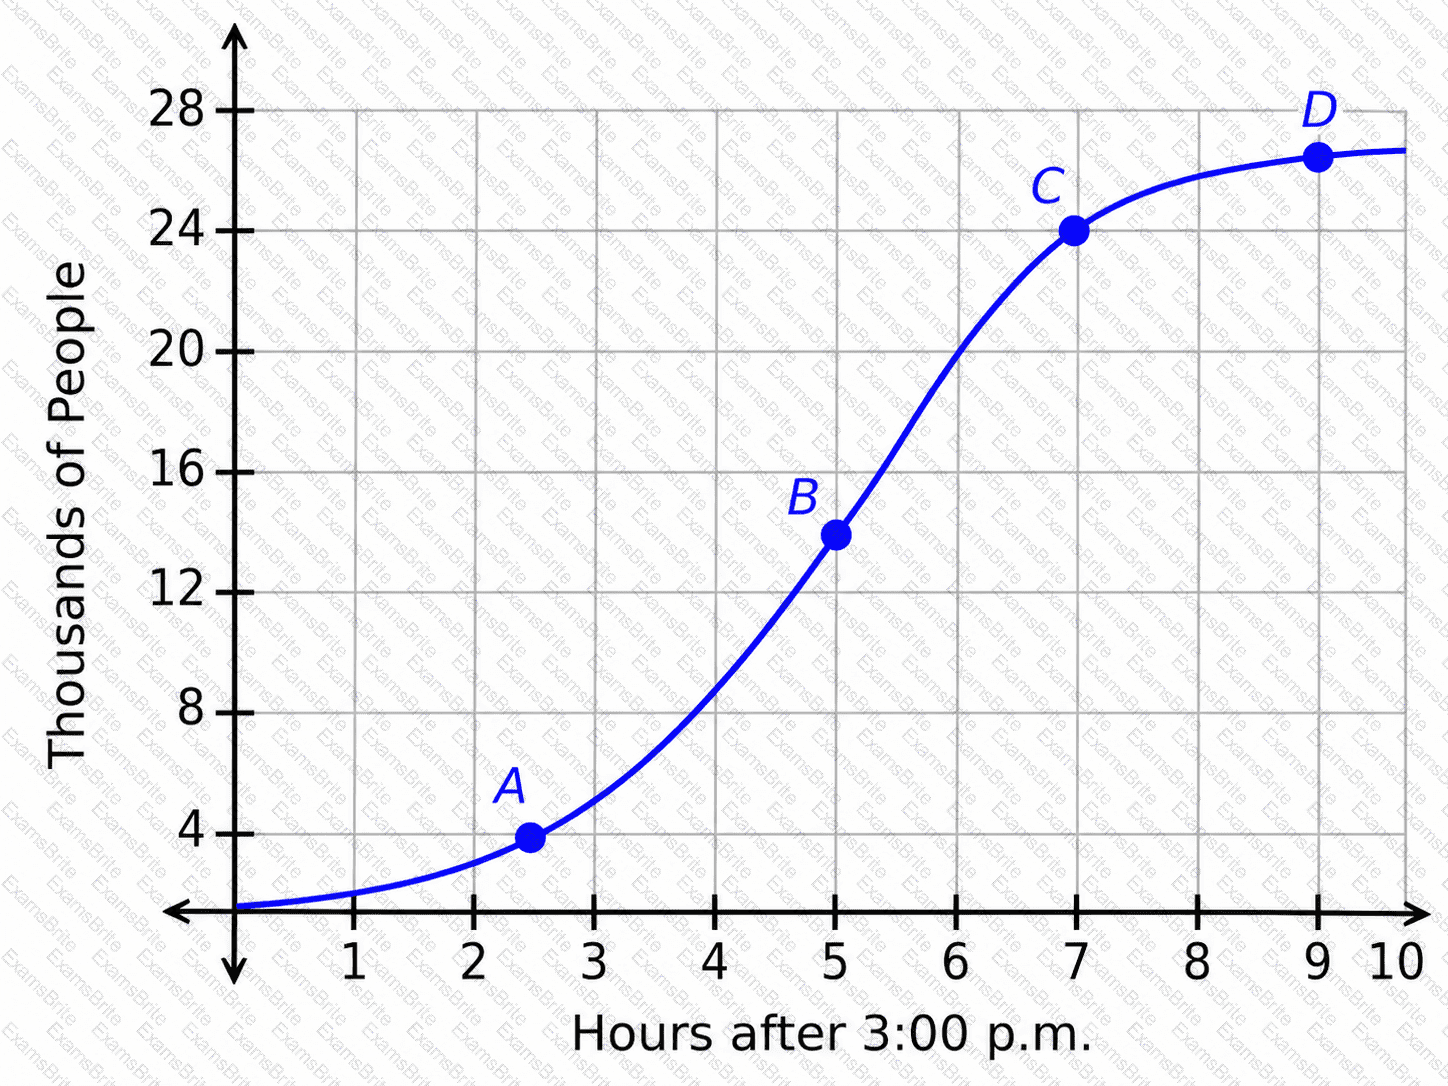
The graph shows the number of people at an event venue after 3:00 p.m., in thousands.
Which rate of change is the greatest?
Consider the function
w(t)=0.03t^4-0.81t^3+7.55t^2-26.62t+44
which represents the number of workers, w, at a job site thours after 6:00 a.m.
What is the difference between w(4)and w(8)?
In the graph showing the number of daily homework problems assigned for a math class, the horizontal axis shows the number of school days since the beginning of the term and the vertical axis shows the number of daily homework problems.
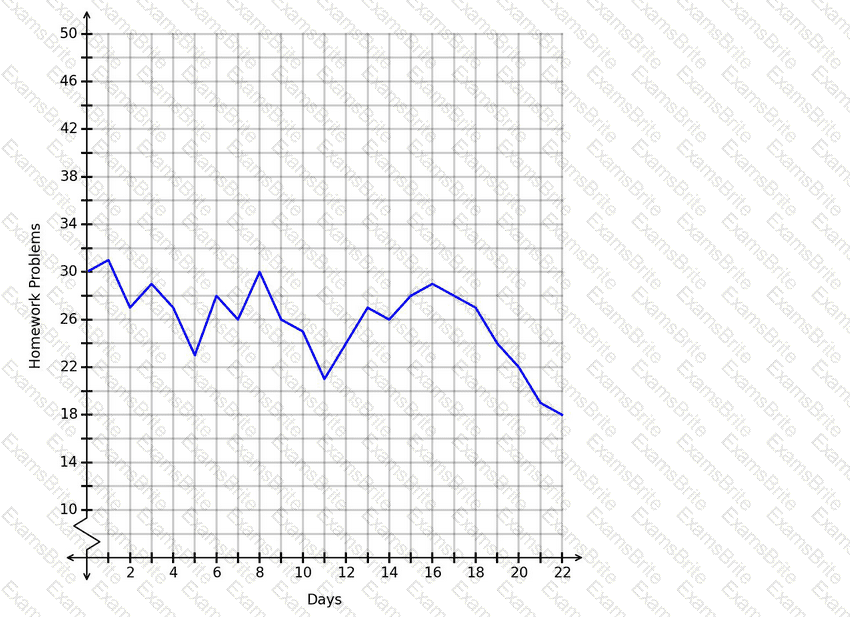
Which conclusion is correct based on this graph?
Based on collected data, the value of a painting can be modeled using the exponential function f(x)=240(1.12)
x
. In this case, x represents the number of years since 2005, and f(x) represents the value of the painting in dollars.
Which value represents the average yearly rate of change of the painting’s value from 2013 to 2015?
The number of letters processed daily at a mail center is modeled by the decreasing exponential function shown in the graph.
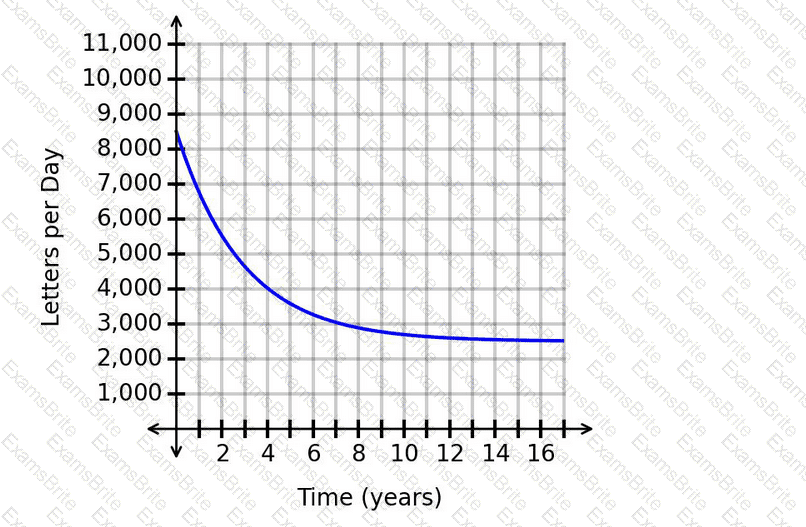
Which value is the number of letters processed per day trending toward as time progresses, based on the equation of the horizontal asymptote?
The number of new user accounts per day on a website is modeled by a decreasing exponential function. The graph of the function is shown.
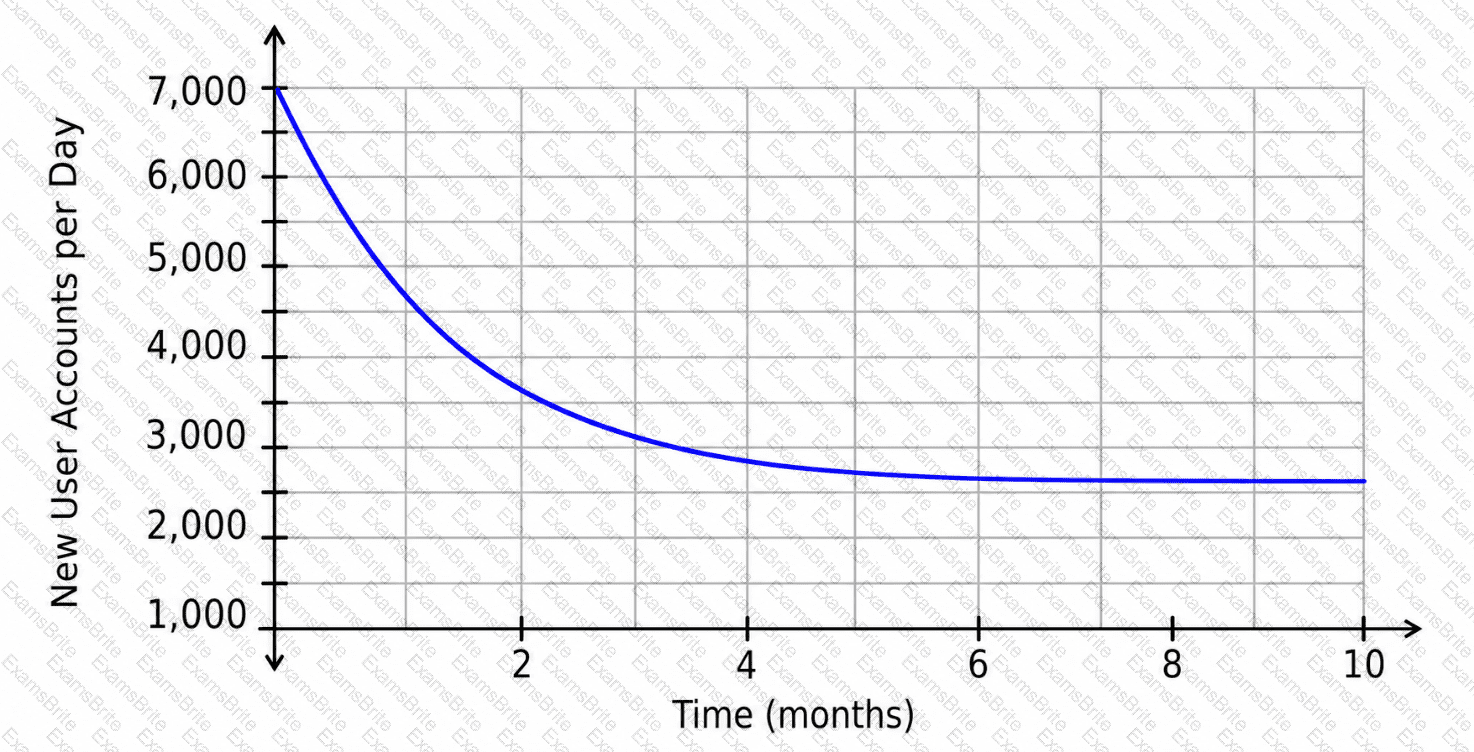
Which statement is justified considering the location of the horizontal asymptote?
The function d(x)=14+65xrepresents the distance, in meters, from a tower to an object at time x, in seconds.
What is the value of d(1.5)?
The graph shows the progress of a manufacturing team, modeling the number of widgets the team is able to produce each day since the team was formed.
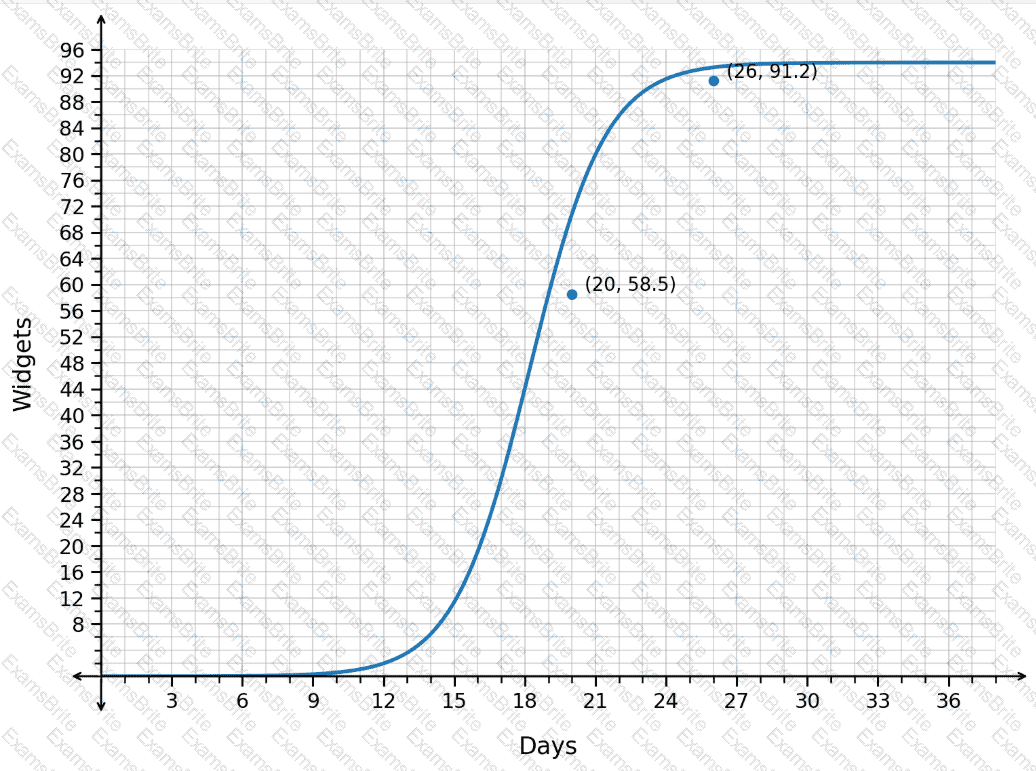
How should the average rate of change from day 20 to day 26 be interpreted?
A new company just launched and is using the function M(t)to predict its market share after tyears. The graph of M(t)is shown.
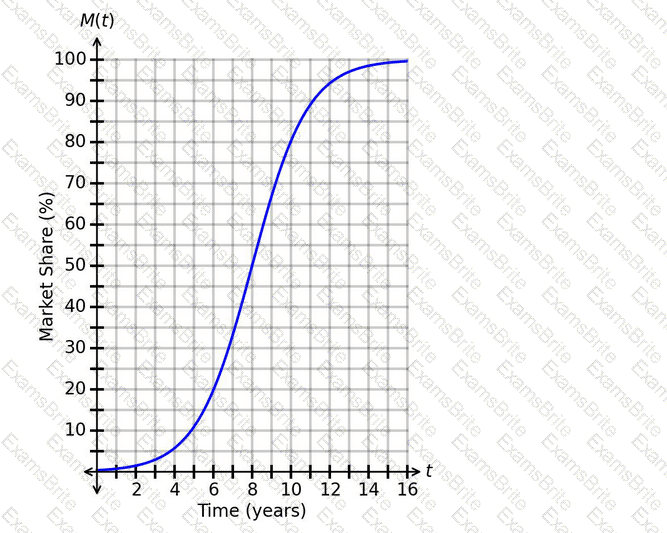
When should the company expect to have a market share of 40%?
The function f(n) represents the relationship between the distances traveled by two vehicles, where n is the distance traveled by vehicle A and f is the distance traveled by vehicle B. The distance traveled by vehicle B is 17 more than the distance traveled by vehicle A.
Which function represents this situation?
The value of a collectible coin can be modeled by F(t), where t represents years since the number of years since the coin was found, and the vertical axis represents the value, in thousands of dollars.
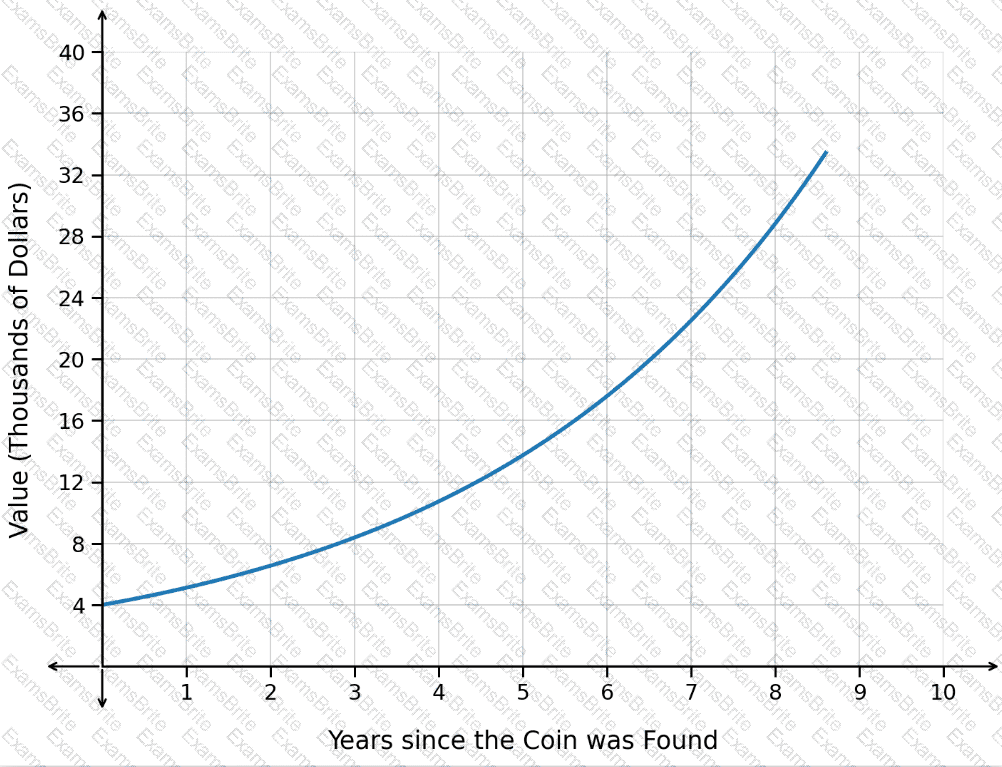
How is the value of the coin changing over time based on the graph?
Consider the function I(m)=41m²−490m+30, which represents the daily income, I, in dollars, of a store based on the number of months, m, since the beginning of the year. What is the difference between I(7) and I(9)?
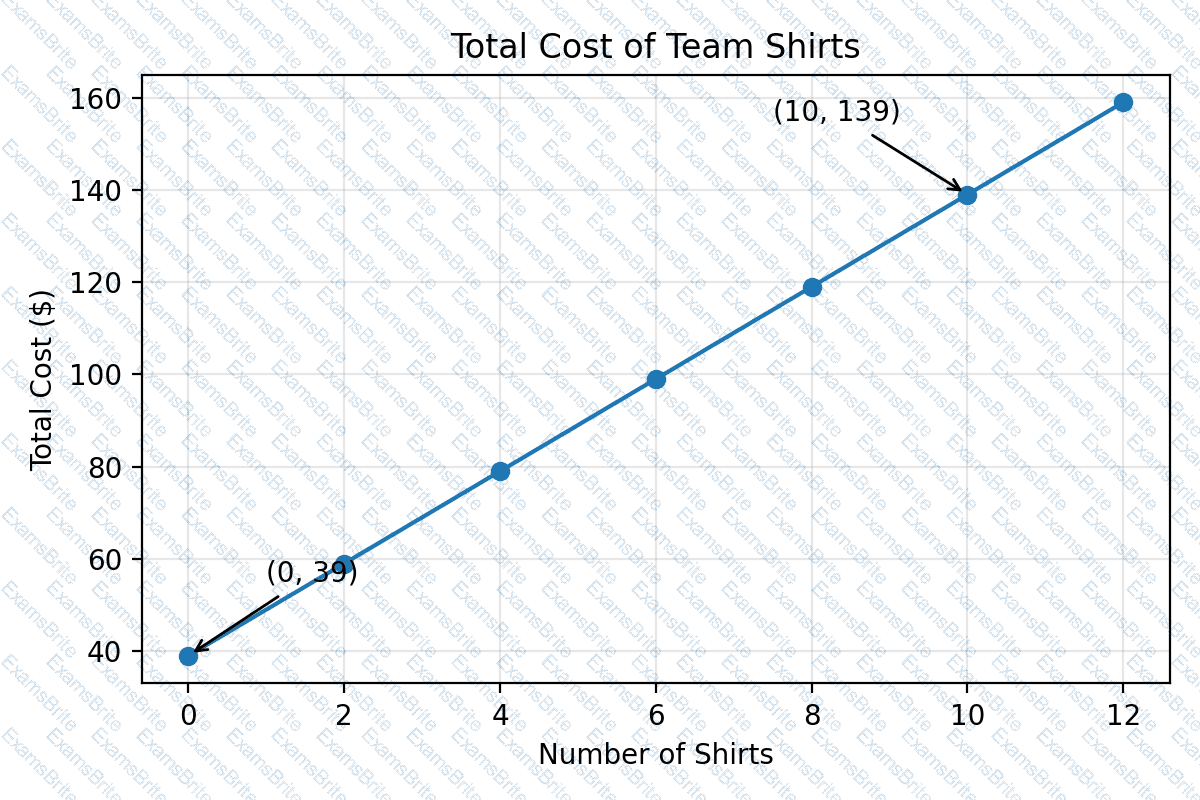
A coach is placing an order for team shirts. The graph shows the total cost based on the number of shirts. What is the cost of each additional shirt?
Exhibit:
The logistic function f(x), whose graph is shown, models the number of people who have created a website account, where xrepresents the number of days since the website started and f(x)represents the number of people who have created an account.
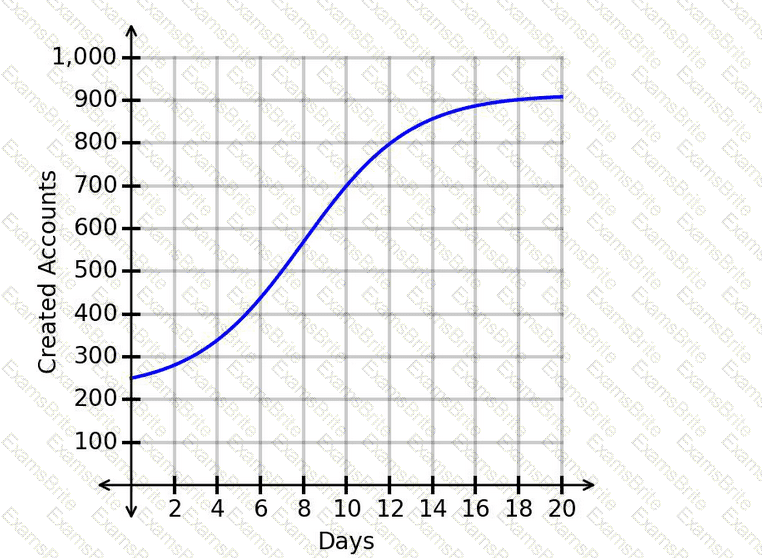
What is one range of values for which the graph is concave down?
The temperature of an object changes according to the relationship in the graph.
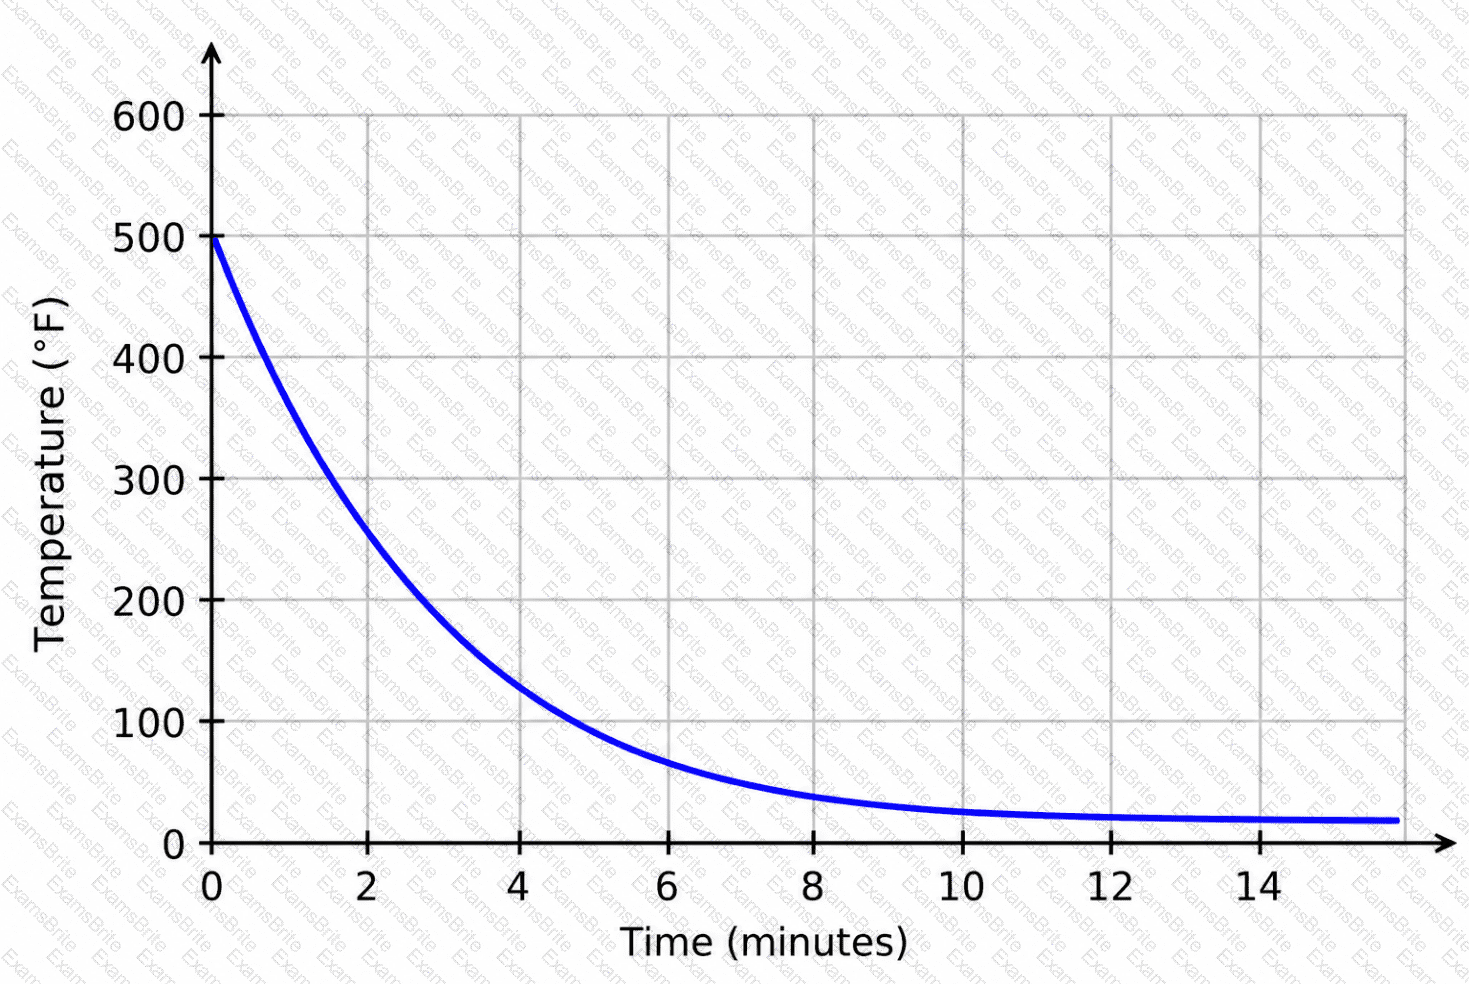
Which equation represents the horizontal asymptote of the function?
The population of fish in a lake is changing according to the function
P(t)=462-35t
where tis the number of months since the beginning of the year and P(t)is the fish population at time t.
Which interpretation of the rate of change is correct?
A music student attempted to learn a difficult new song. Each day, the student would play the song and be scored on their performance. The graph shows the results.
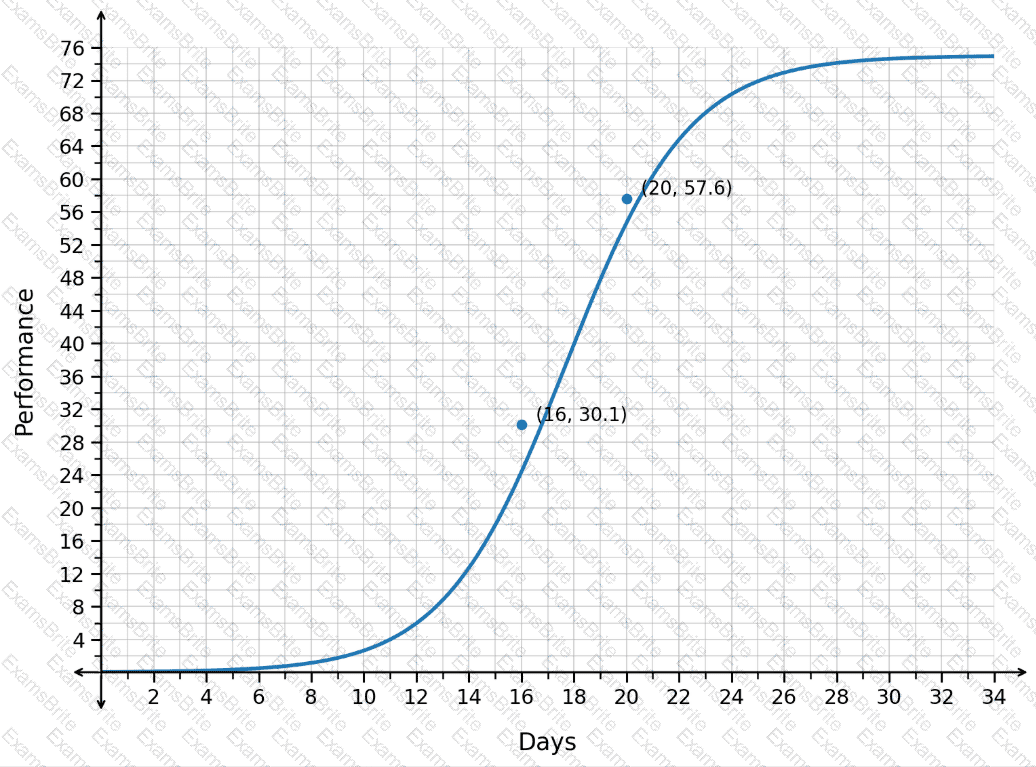
What was the average daily change in performance from day 16 to day 20?
As sacks are unloaded off a wagon, the total weight of the wagon and sacks changes. Each sack has the same weight. After 5 sacks are removed, the total weight of the wagon and remaining sacks is 135 pounds. After 9 sacks are removed, the total weight is 87 pounds. What is the weight of each sack?
A new company just launched and is using the function M(t)to predict its market share after tyears. The graph of M(t)is shown.
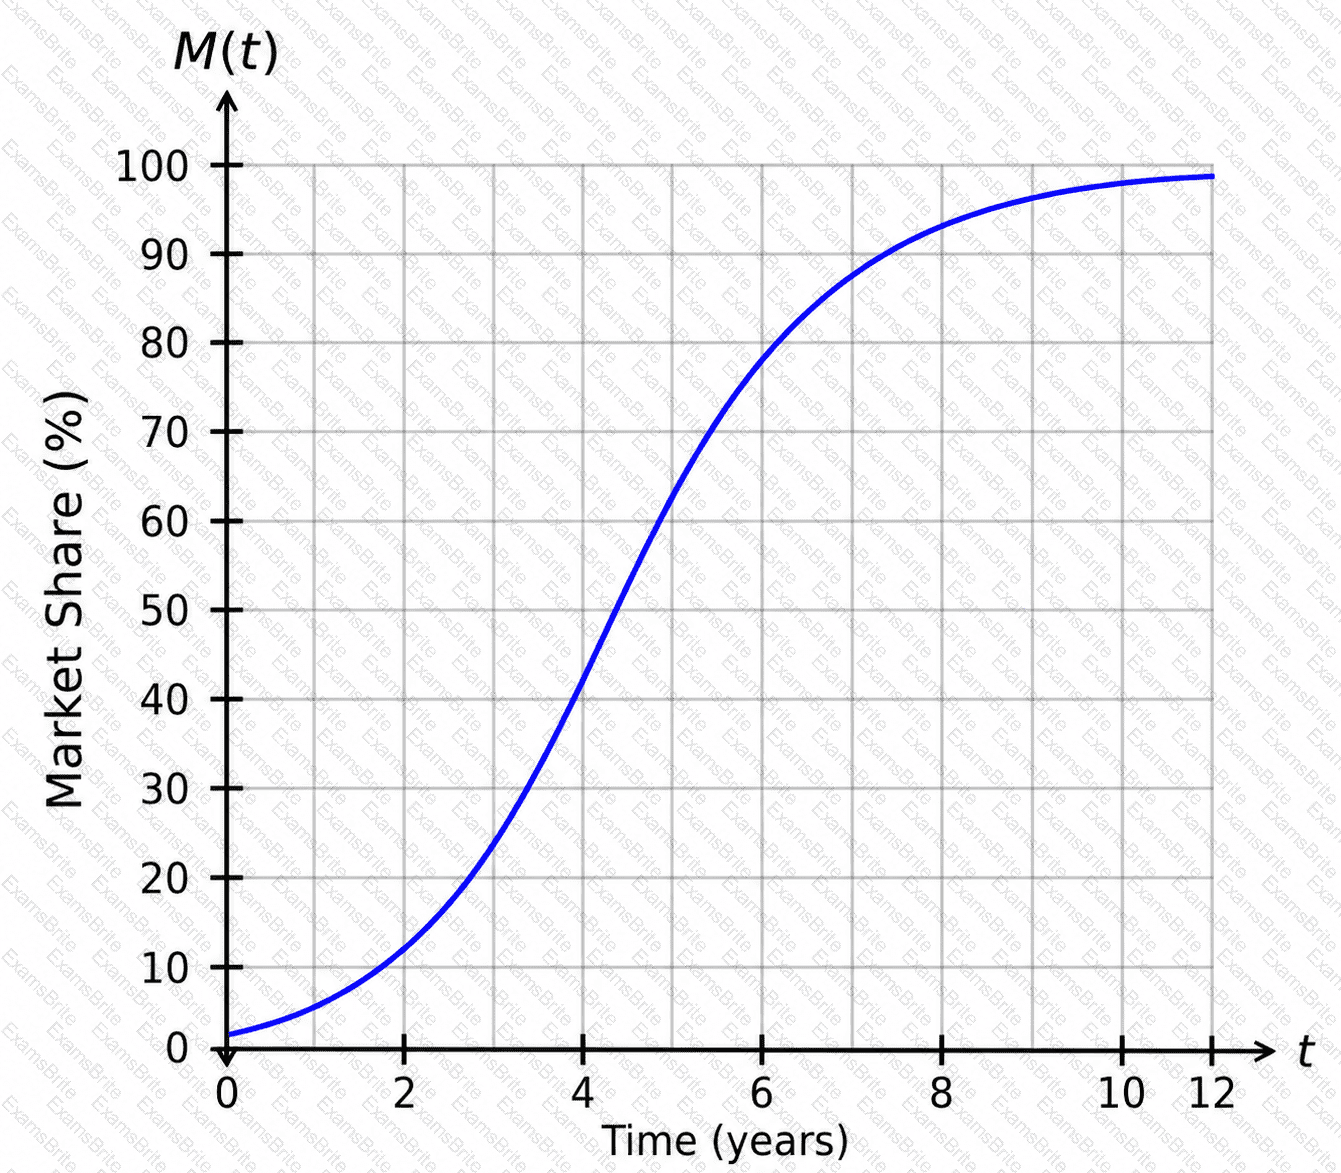
When should the company expect to have a market share of 60%?
The scatterplot shows data on the number of visitors to a resort each week since opening. A regression function is graphed with r^2=0.99. The predicted number of visitors after 16.4weeks is 38.6.
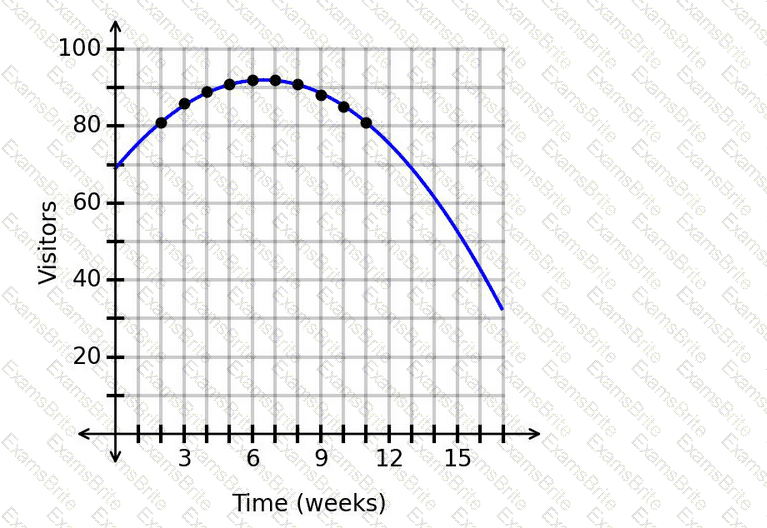
Is this prediction appropriate?
The number of property sales in a region this year is expected to be 8 times the number of property sales in the region last year. The function H(x)represents the number of property sales this year, where xrepresents the number of properties sold last year.
Which notation represents the number of property sales this year, given that the number of properties sold last year was 360?
A researcher collected data on the number of books donated per month to a thrift store over time. The results are shown in the scatterplot. A regression function is graphed with r
2
=0.99.
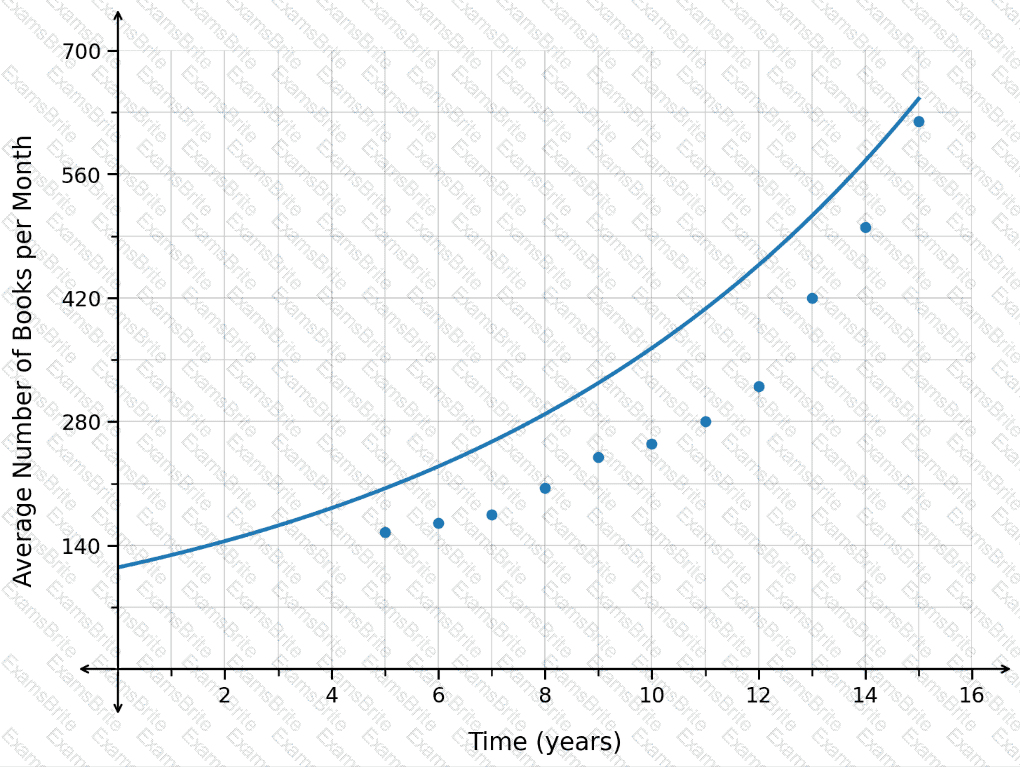
Which range of x-values is appropriate for extrapolation?

TESTED 20 Sep 2026