
Salesforce Certified Tableau Consultant
Last Update Jun 27, 2026
Total Questions : 100
We are offering FREE Analytics-Con-301 Salesforce exam questions. All you do is to just go and sign up. Give your details, prepare Analytics-Con-301 free exam questions and then go for complete pool of Salesforce Certified Tableau Consultant test questions that will help you more.


From the desktop, open the CC workbook. Use the US Population Estimates data source.
You need to shape the data in US Population Estimates by using Tableau Desktop. The data must be formatted as shown in the following table.
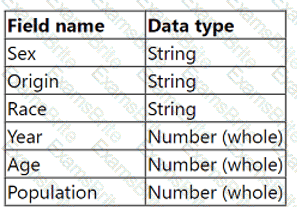
Open the Population worksheet. Enter the total number of records contained in the data set into the Total Records parameter.
From the File menu in Tableau Desktop, click Save.

From the desktop, open the NYC
Property Transactions workbook.
You need to record the performance of
the Property Transactions dashboard in
the NYC Property Transactions.twbx
workbook. Ensure that you start the
recording as soon as you open the
workbook. Open the Property
Transactions dashboard, reset the filters
on the dashboard to show all values, and
stop the recording. Save the recording in
C:\CC\Data\.
Create a new worksheet in the
performance recording. In the worksheet,
create a bar chart to show the elapsed
time of each command name by
worksheet, to show how each sheet in
the Property Transactions dashboard
contributes to the overall load time.
From the File menu in Tableau Desktop,
click Save. Save the performance
recording in C:\CC\Data\.
From the desktop, open the CC workbook.
Open the City Pareto worksheet.
You need to complete the Pareto chart to show the percentage of sales compared to the percentage of cities. The chart must show references lines to visualize how the data compares to the Pareto principle.
From the File menu in Tableau Desktop, click Save.
From the desktop, open the CC workbook.
Open the Manufacturers worksheet.
The Manufacturers worksheet is used to
analyze the quantity of items contributed by
each manufacturer.
You need to modify the Percent
Contribution calculated field to use a Level
of Detail (LOD) expression that calculates
the percentage contribution of each
manufacturer to the total quantity.
Enter the percentage for Newell to the
nearest hundredth of a percent into the
Newell % Contribution parameter.
From the File menu in Tableau Desktop, click
Save.
Use the following login credentials to sign in
to the virtual machine:
Username: Admin
Password:
The following information is for technical
support purposes only:
Lab Instance: 40201223
To access Tableau Help, you can open the
Help.pdf file on the desktop.

From the desktop, open the CC workbook.
Open the Categorical Sales worksheet.
You need to use table calculations to
compute the following:
. For each category and year, calculate
the average sales by segment.
. Create another calculation to
compute the year-over-year
percentage change of the average
sales by category calculation. Replace
the original measure with the year-
over-year percentage change in the
crosstab.
From the File menu in Tableau Desktop, click
Save.
A client is using the Tableau Content Migration Tool to move content from an old Tableau Server to a new Tableau Server.
Which content will need to be moved using a different tool or process?
From the desktop, open the CC workbook.
Open the Incremental worksheet.
You need to add a line to the chart that
shows the cumulative percentage of sales
contributed by each product to the
incremental sales.
From the File menu in Tableau Desktop, click
Save.
A new Tableau user created a simple dashboard on Tableau Server using supply chain data. Now, the user wants to know if they created the dashboard in
accordance with specific performance best practices.
Which approach should the consultant recommend for the client to make this determination?
A consultant creates a histogram that presents the distribution of profits across a client's customers. The labels on the bars show percent shares. The consultant
used a quick table calculation to create the labels.
Now, the client wants to limit the view to the bins that have at least a 15% share. The consultant creates a profit filter but it changes the percent labels.
Which approach should the consultant use to produce the desired result?
A client collects information about a web browser customers use to access their website. They then visualize the breakdown of web traffic by browser version.
The data is stored in the format shown below in the related table, with a NULL BrowserID stored in the Site Visitor Table if an unknown browser version
accesses their website.

The client uses "Some Records Match" for the Referential Integrity setting because a match is not guaranteed. The client wants to improve the performance of
the dashboard while also getting an accurate count of site visitors.
Which modifications to the data tables and join should the consultant recommend?
A client wants to see the average number of orders per customer per month, broken down by region. The client has created the following calculated field:
Orders per Customer: {FIXED [Customer ID]: COUNTD([Order ID])}
The client then creates a line chart that plots AVG(Orders per Customer) over MONTH(Order Date) by Region. The numbers shown by this chart are far higher
than the customer expects.
The client asks a consultant to rewrite the calculation so the result meets their expectation.
Which calculation should the consultant use?
A client builds a dashboard that presents current and long-term stock measures. Currently, the data is at a daily level. The data presents as a bar chart that
presents monthly results over current and previous years. Some measures must present as monthly averages.
What should the consultant recommend to limit the data source for optimal performance?
A consultant builds a report where profit margin is calculated as SUM([Profit]) / SUM([Sales]). Three groups of users are organized on Tableau Server with the
following levels of data access that they can be granted.
. Group 1: Viewers who cannot see any information on profitability
. Group 2: Viewers who can see profit and profit margin
. Group 3: Viewers who can see profit margin but not the value of profit
Which approach should the consultant use to provide the required level of access?
A client has many published data sources in Tableau Server. The data sources use the same databases and tables. The client notices different departments
give different answers to the same business questions, and the departments cannot trust the data. The client wants to know what causes data sources to return
different data.
Which tool should the client use to identify this issue?
A consultant wants to improve the performance of reports by moving calculations to the data layer and materializing them in the extract.
Which calculation should the consultant use?
A stakeholder has multiple files saved (CSV/Tables) in a single location. A few files from the location are required for analysis. Data transformation (calculations)
is required for the files before designing the visuals. The files have the following attributes:
. All files have the same schema.
. Multiple files have something in common among their file names.
. Each file has a unique key column.
Which data transformation strategy should the consultant use to deliver the best optimized result?
A Tableau consultant tasked with evaluating a data structure is handed the below sample dataset.
Which two statements are true about the dataset? Choose two.

A client wants to view stores serviced by delivery drivers on a map. The have the information provided in the table below:
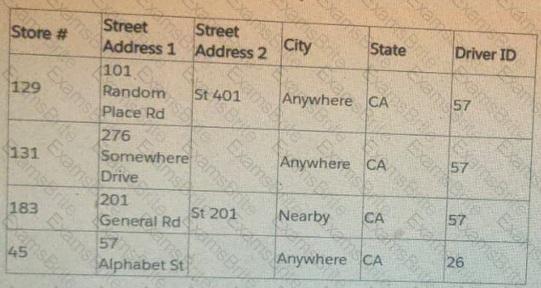
What does the client need to do to plot exact street addresses on the map?
A client has a dashboard that uses a bar chart to visualize sales by Sub-Category and a detail table that has all the orders for the products within Sub-
Category. The table has more than 10,000 rows of data and is slow to load.
A consultant plans to add an action so when the client interacts with the bar chart, only the relevant data appears in the table.
What will provide the fastest rendering of the dashboard?
A business analyst is creating a view of the top 10 customers for each region. The analyst has set a "Top 10" filter on Customer Name. However, it did not display the top 10 customers per region, as shown in the image below.

Which type of filter should the business analyst add to filter for region?

TESTED 27 Jun 2026